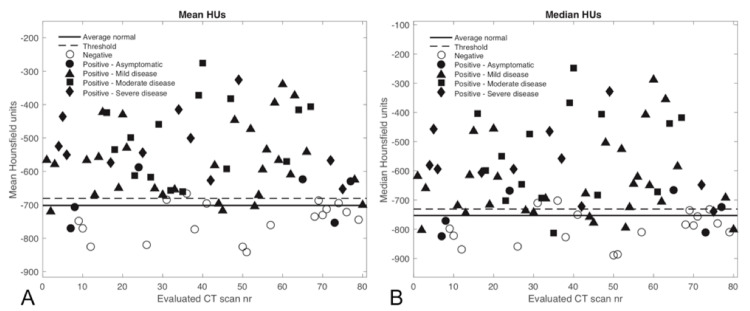
Figure 3. The considered statistical measures are shown for each evaluated CT scan along with the threshold levels determined from the mean normal histogram and the value from the average normal histogram for A) Mean HUs and B) Median HUs. Values above the threshold are considered abnormal.
CT - Computed tomography; HU - Hounsfield units; nr - Number.

