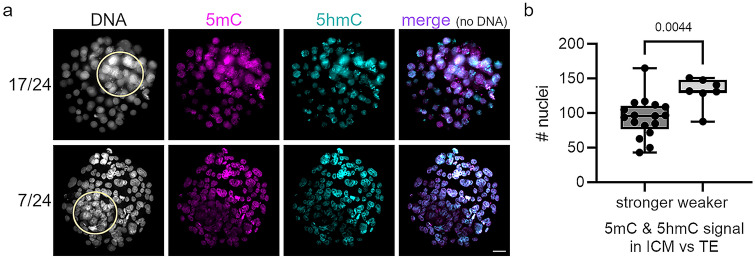
Fig. 3.
Immunofluorescence analysis of human blastocysts. a Representative immunofluorescence images of human blastocysts analyzed for 5mC (magenta), 5hmC(cyan), and DNA signals (white). The major fraction of human blastocysts (17 of 24, upper panel) show stronger 5mC and 5hmC signals in the inner cell mass (ICM) compared to the trophectoderm; a smaller subset (7 of 24, lower panel) show weaker 5mC and 5hmC signals in the ICM compared to trophectoderm. The ICM is indicated by a yellow circle. Scale bar = 20 μm. b Number of cells per blastocyst with stronger or weaker 5mC and 5hmC signals in the ICM compared to trophectoderm. Each dot represents a single blastocyst. Statistically significant differences were calculated using two-tailed Student’s t test

