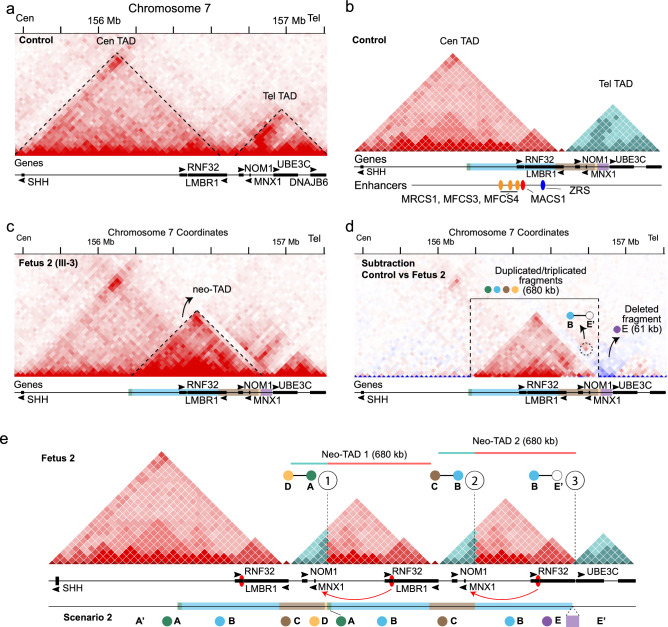
Fig. 4.
3D chromatin landscape at the SHH locus in healthy and affected fibroblasts. a Hi-C map of control fibroblast sample (25 kb resolution; raw data) showing the 3D landscape of the 7q36.3 locus. Genes (black rectangles; arrows indicate the orientation of the transcript) are listed below. b Schematic representation of TAD structures on the 7q36.3 region in a wild-type sample (the centromeric TAD in red and the telomeric one in blue). MACS1 and ZRS enhancers (colored in red and blue, respectively) are shown on the track below. Additional known oral and pharyngeal epithelium enhancers are shown in orange. c Hi-C map from fibroblasts the Fetus 2 revealed ectopic signal due to novel chromatin contacts. d Subtracted map shows the gain of new chromatin interaction in the fetus. Red: gain of contact, blue: loss of contact. e Schematic representation of the derivative 7q36.3 3D structure caused by the complex genomic rearrangement. Observe the formation of two neo-TADs, both allowing ectopic interaction of MACS1 with MNX1 and NOM1 promoters (red arrows). Based on our analysis, both scenarios 1 and 2 are compatible to be true, i.e., they would give roughly similar outcomes related to 3D genome architecture reconstruction; therefore both are likely for being causative. In this work, we choose Scenario 2 for merely illustration purpose

