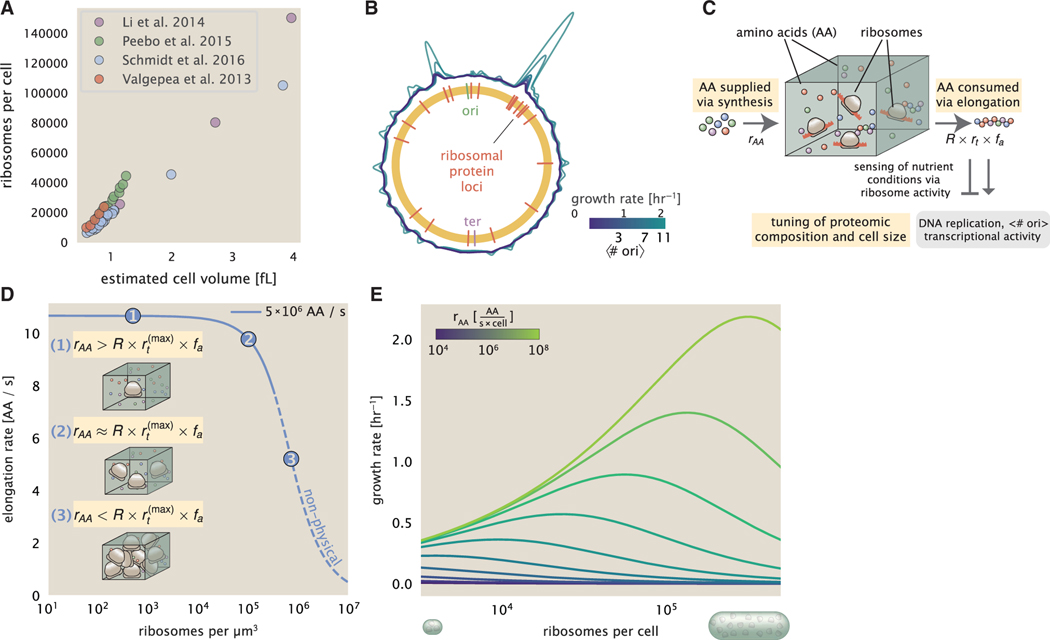
Figure 7. Coordination of cell size and proteomic composition via ribosome activity.
(A) Plot of the ribosome copy number estimated from the proteomic data against the estimated cell size (see supplemental information “estimation of cell size and surface area” for details on the calculation of cell size).
(B) A running Gaussian average (20 kbp SD) of protein copy number is calculated for each growth condition considered by ( Schmidt et al., 2016) based on each gene’s transcriptional start site. Since total protein abundance increases with growth rate, protein copy numbers are median subtracted to allow comparison between growth conditions. are estimated using data from Si et al. (2017) (see supplemental information “estimation of for additional details).
(C) We consider a unit volume of cellular material composed of amino acids (colored spheres) provided at a supply rate rAA. These amino acids are polymerized by a pool of ribosomes (brown blobs) at a rate rt × R × fa, where rt is the elongation rate, R is the ribosome copy number in the unit volume, and fa is the fraction of those ribosomes actively translating. In addition to determining total protein synthesis rate, the nutrient status is gauged by any accumulation of de-acylated tRNAs and synthesis of the secondary messenger (p)ppGpp, which ultimately determine , cell size, and proteomic composition.
(D) The observed elongation rate is plotted as a function of the number of ribosomes. The three points correspond to three regimes of ribosome copy numbers and are shown schematically on the left-hand side. The region of the curve shown as dashed lines represents a non-physical copy number but is shown for illustrative purposes. This curve was generated using an amino acid supply rate of 5 × 10⁶ AA / s, a maximal elongation rate of 17.1 AA / s, fa = 1, and a unit cell volume of 1 fL. See supplemental information “derivation of minimal model for nutrient-mediated growth rate control” for additional model details.
(E) The cellular growth rate is plotted as a function of total cellular ribosome copy number for different cellular amino acid supply rates, with blue and green curves corresponding to low and high supply rates, respectively. As the ribosome copy number is increased, so too is the cell size and total protein abundance Npep.

