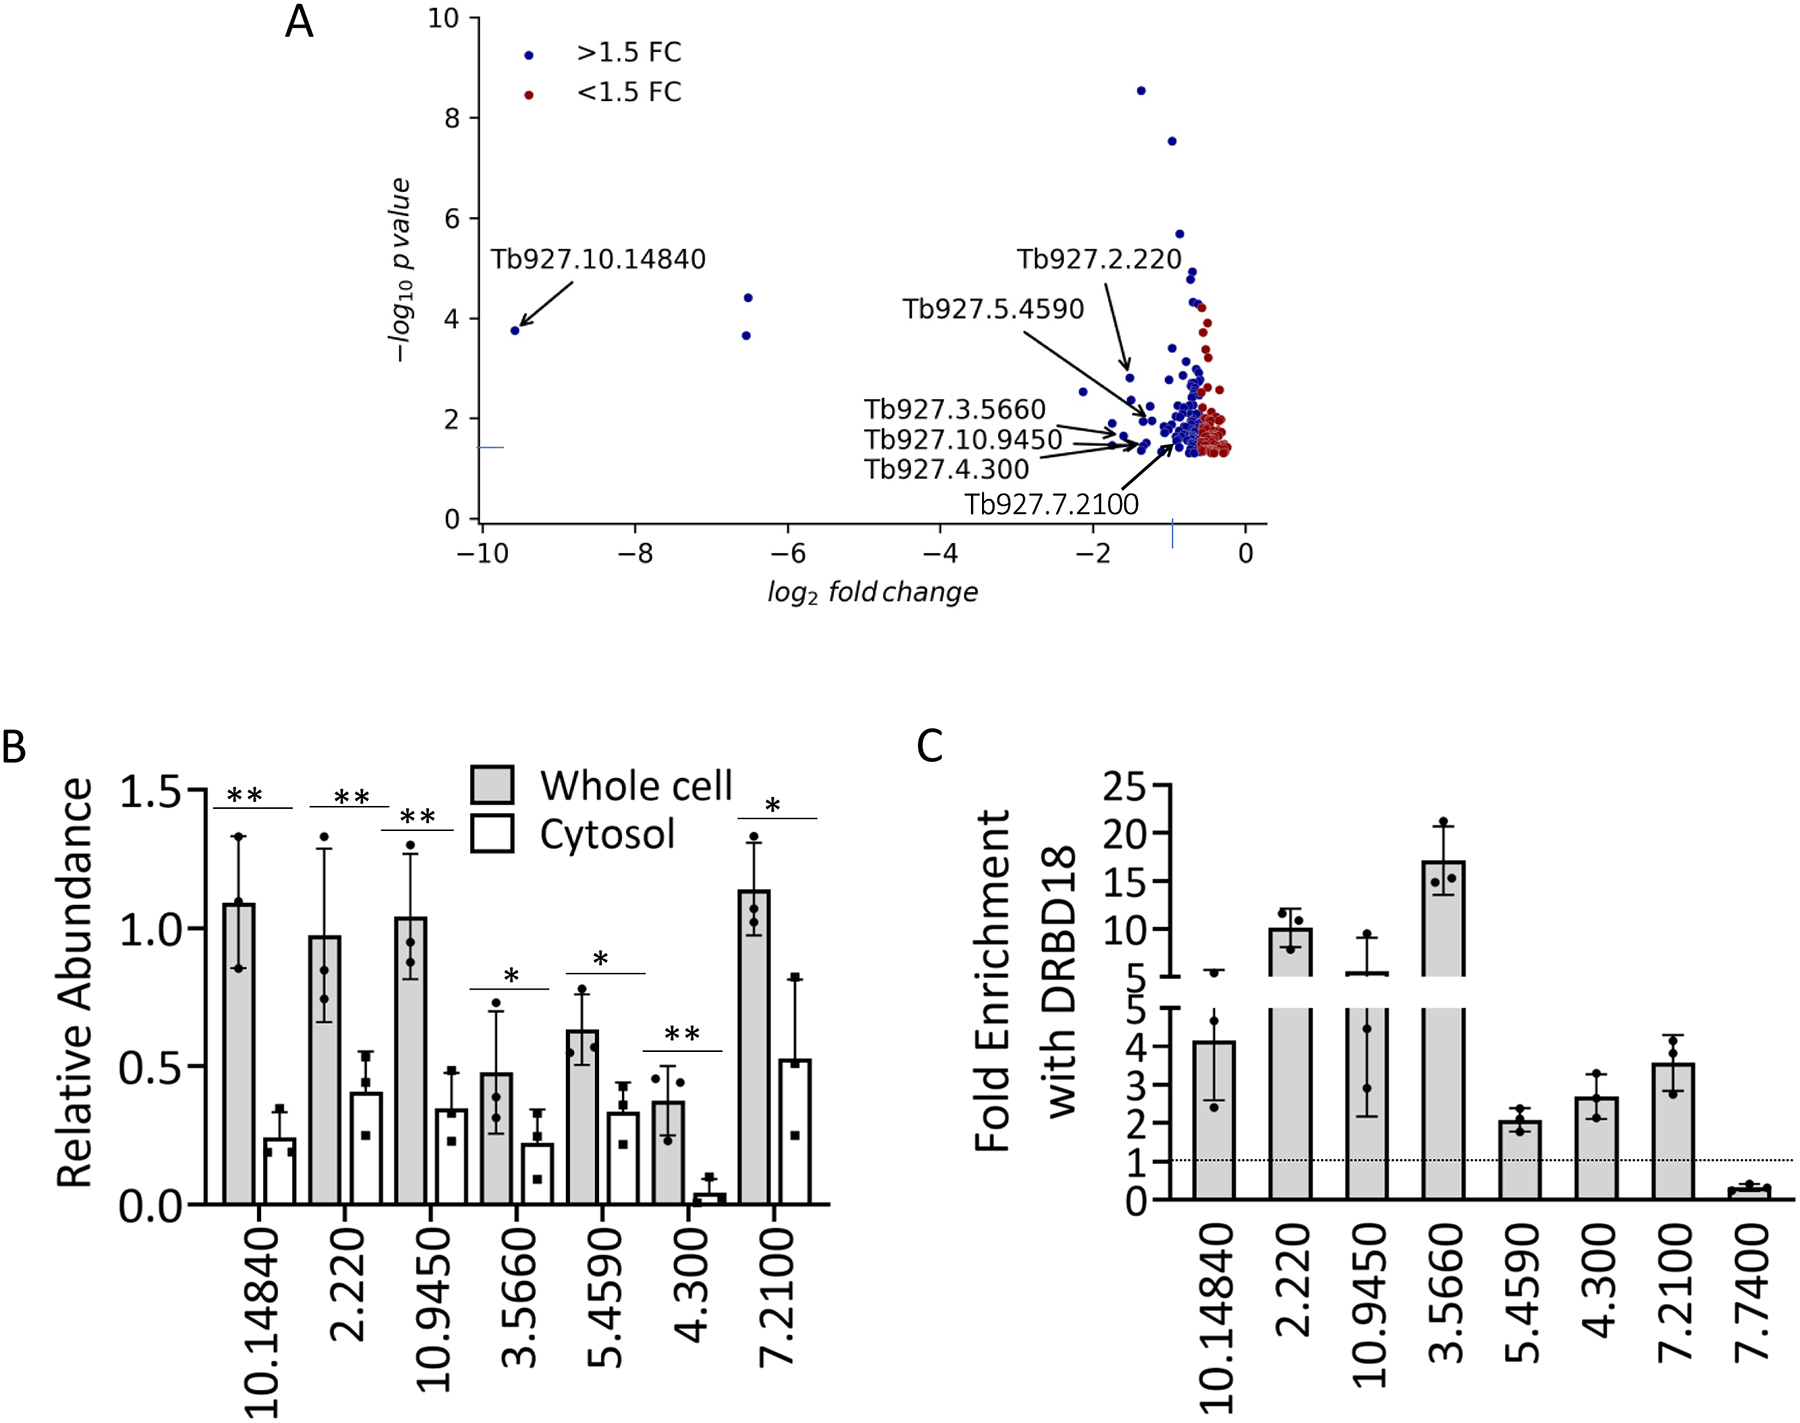
Figure 5. DRBD18 RNAi inhibits export of a subset of mRNAs from nucleus to cytosol and associates with differentially transported mRNAs.

(A) Volcano plot (generated from RNAseq data) of transcripts whose abundance is decreased in cytosol but unchanged in whole cell RNA (corrected p-value <0.05) upon DRBD18 RNAi. Transcripts with fold change (FC) >1.5 are colored blue, and those with FC <1.5 are red. Transcripts analyzed in Fig. 5B are indicated by their TriTrypDB numbers. (B) Representative transcripts, identified by the last four to seven digits of their TriTrypDB numbers, were quantified by qRT-PCR in whole cell and cytosolic fractions. Relative abundance represents RNA levels in induced (+Dox) cells compared to levels in uninduced (−Dox) cells. RNA levels were normalized to 18S rRNA. Values represent the mean of three biological replicates, each with three technical replicates. Significance was determined by unpaired t-test. **p < 0.01; *p < 0.05. (C) Enrichment of transcripts shown in (B) in anti-DRBD18 immunoprecipitations relative to a non-specific antibody control was measured by UV Cross-Linking ImmunoPrecipitation (CLIP). The 7.7400 transcript serves as a negative control. Values represent the mean of three biological replicates, each with three qRT-PCR technical replicates. A value of 1 (dotted line) indicates no enrichment.
