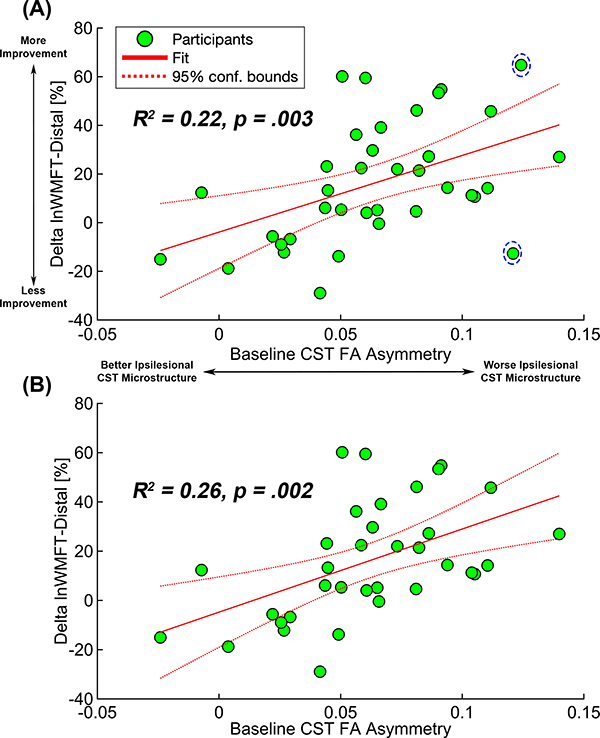
Figure 2.
Linear regression between baseline CST FA asymmetry and Δ WMFT-distal_%. Green dots indicate individual data points of participants, the solid red line is the fit of the linear regression between baseline CST FA asymmetry and changes in log-transformed average WMFT for distal control items, and the dotted red lines indicate 95% confidence interval of the fit. (A) A regression model with all 37 participants. Two participants in the dashed circle were determined as influential data points. (B) In the regression model with 35 participants, 2 influential data points marked in (A) were excluded. CST FA indicates corticospinal tract fractional anisotropy; WMFT, Wolf Motor Function Test. This figure is available in color online (www.jnpt.org).

