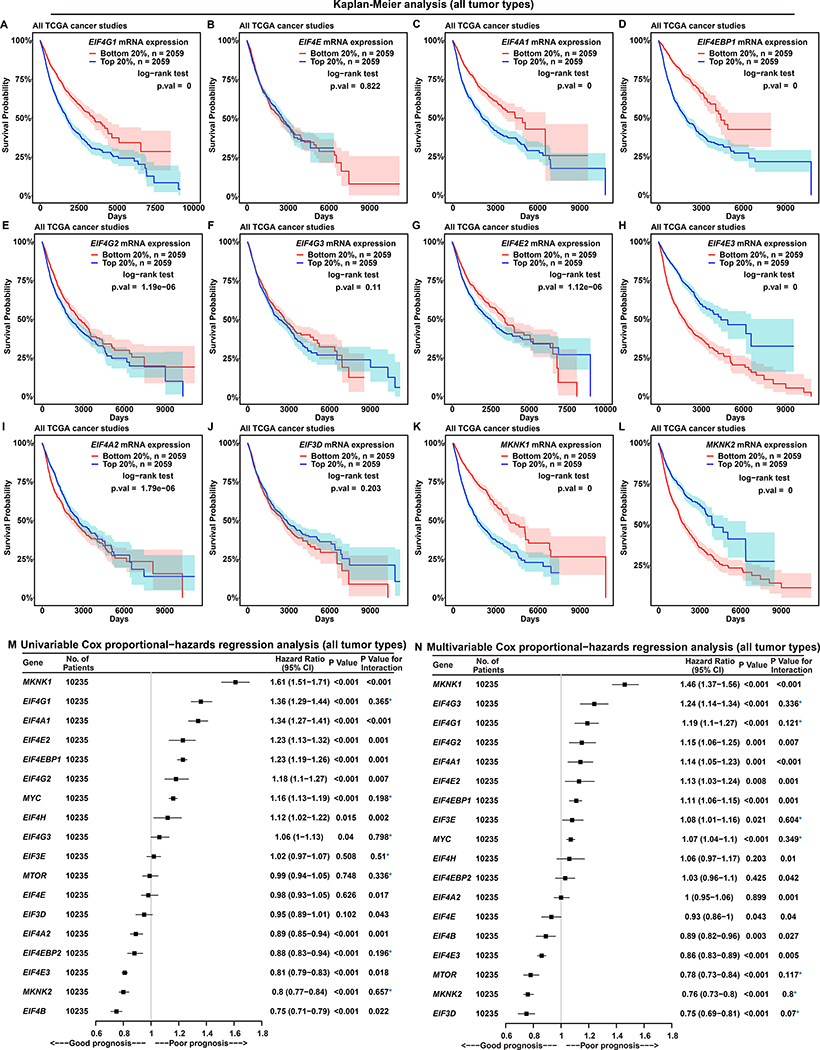
Figure 2. EIF4G1 Expression Is a Strong Predictor for Survival in Patients with Cancer.
(A to L) Each Kaplan-Meier plot shows survival probabilities of TCGA patients with cancer according to mRNA expressions of a specific translation initiation gene (marked inside each box, at top) in their tumors. Survival probability (Y axis) is the probability of individual survival from the time origin (e.g. initial cancer diagnosis) to a specified time (X axis). We ranked all 10,295 TCGA patients with cancer based on the indicated individual gene expressions from their tumor biopsies, and selected two groups of patients with the top or bottom 20% of gene expression. Differences in survival probabilities between the two selected groups were assessed with the log-rank test. The shaded areas around each curve depict a 95% confidence region for that curve.
(M and N) Univariable (M) and multivariable (N) Cox proportional-hazards regression models for expression of translation initiation genes in all 10,235 patients with cancer from TCGA. P value indicates the statistical significance of association between gene expression and survival (i.e. a significant fit in the Cox-PH model). “P value for interaction” is calculated using the Schoenfeld residual method. P value for interaction < 0.05 indicates statistically significant interaction between gene expression and time, a violation of the Cox proportional-hazards model. Values without violation are marked with a blue asterisk. “CI” means “confidence interval”.

