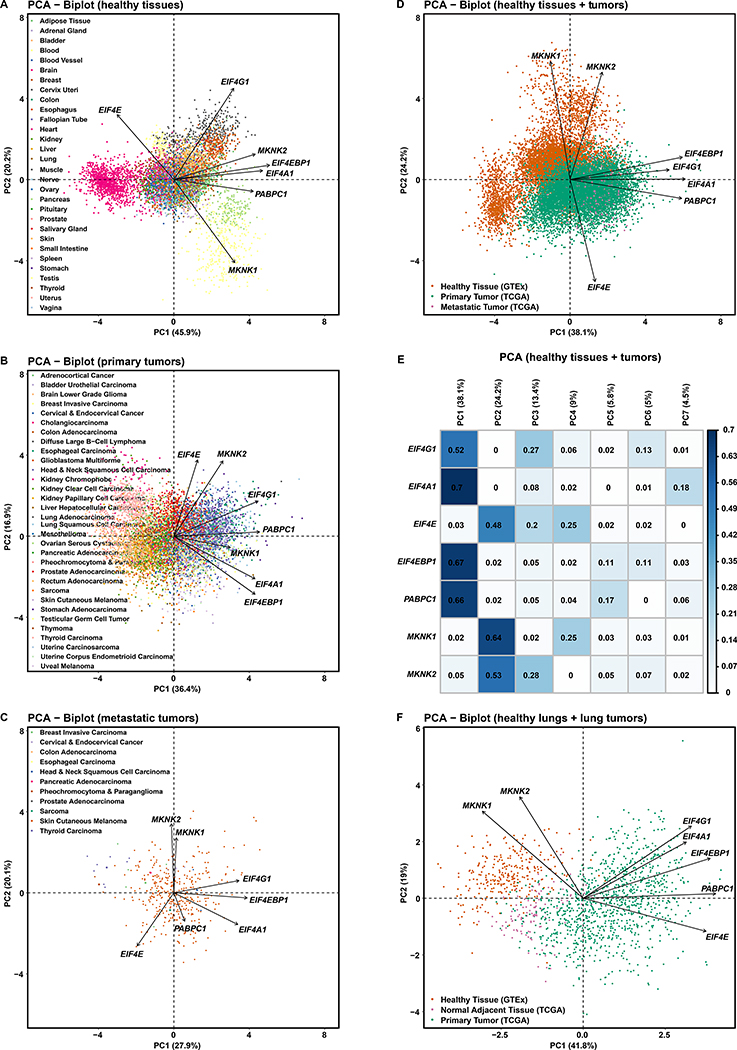
Figure 4. EIF4F Expressions Collectively Better Distinguish Healthy Tissues than Tumor Types.
(A) Principal Component Analysis (PCA) of RNA-Seq-derived counts of EIF4G1, EIF4A1, EIF4E, EIF4EBP1, PABPC1, MKNK1, and MKNK2 from 7,388 tissue samples of various healthy tissue types in GTEx. Tissue types were observations – not used to construct PCs but colored for visualization. The PCA biplot shows the PCs with most significant sample variation. Axis titles show the percentage of variances (squared loadings) explained by PC1 or PC2. Axis values show the PCA scores of individual samples. Arrows show the influence of each gene variable on the PCs.
(B) PCA of normalized RNA-Seq-derived counts of indicated genes from 9,162 primary tumors of 33 cancer types in TCGA. Cancer types were colored after analysis, for visualization.
(C) PCA of normalized RNA-Seq-derived counts of indicated genes from 392 metastatic tumors of 33 cancer types in TCGA. Cancer types were colored afterwards. Note: 366 metastatic tumors are from TCGA skin cutaneous melanoma group.
(D) PCA of normalized RNA-Seq-derived counts of indicated genes from 9,162 primary and 392 metastatic tumors from TCGA, and 7,388 healthy tissue samples from GTEx. RNA-Seq data from TCGA and GTEx have been processed and normalized with the same bioinformatics pipeline to minimize batch effects of sequencing experiments. Sample types were colored after analysis, for visualization.
(E) The matrix plot shows the cos2 value for the contribution of each gene to each PC, from the PCA of TCGA tumor samples and GTEx normal tissue samples in Figure 4D. The sum of values in a given row across all PCs is equal to one (+/− epsilon introduced by rounding each value to two significant figures).
(F) PCA of standardized RNA-Seq-derived counts of indicated genes from 1011 primary lung tumors (517 LUADs and 494 LUSCs) and 109 NATs from TCGA LUAD and LUSC study groups, and 287 healthy lung tissues from GTEx. Sample types were colored after analysis, for visualization.

