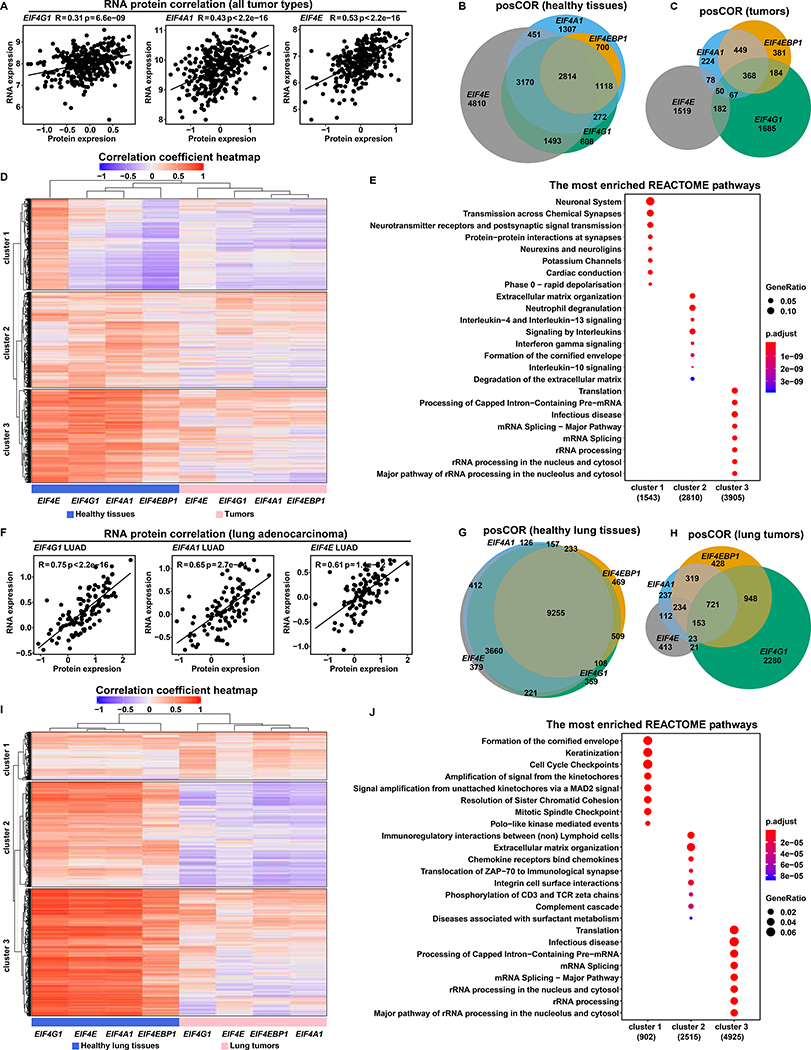
Figure 5. EIF4F Subunits Have More and Stronger Expression Correlations in Healthy Tissues than in Tumors.
(A) The scatter plots show the positive correlation between protein and mRNA expression levels of EIF4G1, EIF4A1 and EIF4E (indicated at top) in tumors. RNA expression levels (log2 transformed and upper quartile normalized) were from Cancer Cell Line Encyclopedia (CCLE) RNA-Seq data (Barretina et al., 2012). Protein expression levels (quantified as the relative abundance of detected peptides to reference, and log2 transformed) were from CCLE proteomics data (Nusinow et al., 2020). The plots include all 375 CCLE cell lines for which both RNA-seq and proteomic data are available.
(B and C) Pearson’s correlation coefficients between EIF4F (EIF4E, EIF4G1, EIF4A1, or EIF4EBP1) and each of 58,582 other genes were calculated separately across 10,323 TCGA tumor samples from different cancer types, or across 7,414 GTEx healthy samples from different tissue types, using the Toil recomputed RNA-Seq datasets. Genes with significant positive (R > 0.3) or negative (R < −0.3) correlations were selected for analysis. Venn diagrams show overlapping posCOR counts for EIF4F genes in healthy tissue samples (B) or in tumors (C).
(D and E) The heatmap (D) shows correlation strengths of posCORs and negCORs in healthy tissues and in tumors. Each row indicates correlation of a gene with each EIF4F gene in healthy tissues (grouped in left-side columns) and tumors (right-side columns). The color and intensity of each heatmap cell represents a Pearson’s correlation coefficient. posCORs are red, negCORs are blue, non-correlations are white. The dendrogram on the top indicates similarity as a hierarchical relationship between the columns: more-similar columns are linked lower in the dendrogram. Rows were ordered by K-means clustering to partition the dataset into three non-overlapping subgroups. Dot plots (E) show the enriched pathways for the three heatmap (D) row clusters, according to REACTOME pathway analysis. The 8 most significantly enriched pathways of each cluster were plotted.
(F) The scatter plots show the positive correlation between protein and mRNA expression levels of EIF4G1, EIF4A1 and EIF4E across 109 LUADs from CPTAC. RNA expression levels (log2 transformed and upper quartile normalized) were from the CPTAC RNA-Seq dataset. Protein expression levels (two-component normalized) were from CPTAC proteomics dataset (Gillette et al., 2020). The plots include all CPTAC LUADs for which both RNA-seq and proteomic data are available.
(G and H) Pearson’s correlation coefficients between EIF4F (EIF4E, EIF4G1, EIF4A1, or EIF4EBP1) and 58,582 other genes were calculated separately across 1,122 lung tumors from LUSC and LUAD TCGA study groups, or across 287 healthy lung tissues from GTEx, using the Toil recomputed RNA-Seq datasets. Genes with significant positive (R > 0.3) or negative (R < −0.3) correlations were selected for analysis. The Venn diagrams show overlapping posCOR counts for EIF4F genes in healthy lungs (G) or lung tumors (H).
(I and J) Analysis is similar to (D and E), but specific to lung samples. The heatmap (I) shows the correlation strengths of posCORs and negCORs for EIF4E, EIF4G1, EIF4A1 and EIF4EBP1 in healthy lungs and in lung tumors. The dot plots (J) show the enriched pathways in three clusters (K-means) of the heatmap (I) yielded by REACTOME pathway analysis.

