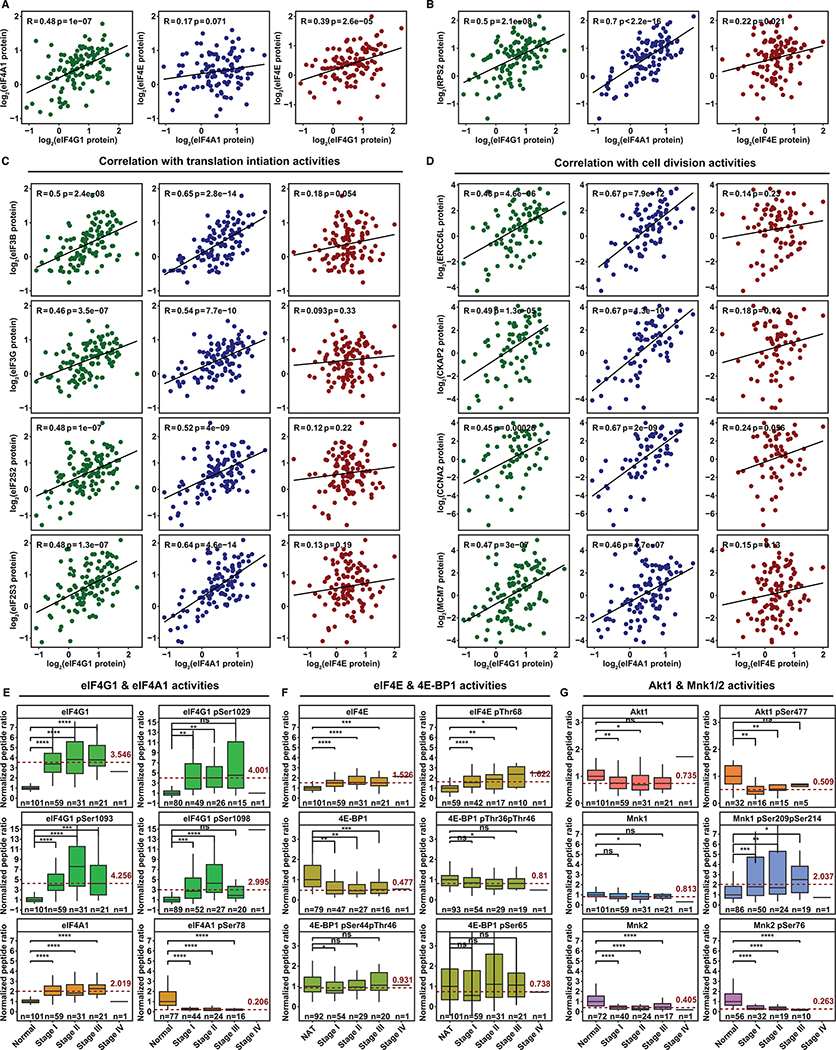
Figure 6. Dysregulated eIF4F Function Favors Cap-Independent Initiation in LUADs.
(A) The scatter plots show correlation of eIF4G1, eIF4A1 and eIF4E protein expression levels with each other across 109 LUADs from CPTAC. The expression level is shown as log2 ratio of protein abundance in sample to a reference by the two-component normalization method (Gillette et al., 2020).
(B) The scatter plots show correlation of protein expression levels between Rps2 and each of three eIF4F subunits across 109 LUADs.
(C) The scatter plots show protein expression correlation of indicated translation initiation factors (rows) and each of three eIF4F subunits (columns) across 109 LUADs.
(D) The scatter plots show protein expression correlation of indicated protein factors involved in cell division (rows) and each of three eIF4F subunits (columns) across 109 LUADs.
(E and F) The box plots show, for eIF4F subunits, ratios to paired NATs (Y axis) of mean peptide abundance (either whole protein or phospho-peptide with phosphorylation at indicated serine or threonine residues). Depicted for NATs and LUADs at each tumor stage are: eIF4G1 (whole protein or phosphorylation at serine 1029, 1093, or 1098), eIF4A1 (whole protein or phosphorylation at serine 78), eIF4E (whole protein or phosphorylation at threonine 68), 4E-BP1 (whole protein, or phosphorylation at threonines 36 and 46, or at serine 44 and threonine 46, or at serine 65). Mean expression from NATs was normalized at 1. Phospho-peptides, containing one or more fully localized phosphorylation modifications, are mapped to reference protein sites for eIF4G1(NP_886553.3), eIF4A1(NP_001407.1), eIF4E(NP_001959.1), and 4E-BP1 (NP_004086.1). Tumor stages (for each column) and sample counts (n, for each plot) are marked on X axes. The dashed red line marks average abundance in all tumor stages combined, relative to NATs. Elevation is pronounced for eIF4G1 phosphorylations (note variation in Y axis ranges). The two-tailed Student’s t tests were performed. ns, not significant; *P ≤ 0.05; **P ≤ 0.01; ***P ≤ 0.001; ****P ≤ 0.0001
(G) The box plots compare abundances of Mnk1/2 and Akt1, and their phosphorylations (Akt1 at serine 477, Mnk1 at serines 209 and 214, Mnk2 at serine 76). Phospho-peptides, containing one or more fully localized phosphorylation modifications, are mapped to reference protein sites for Mnk1(NP_003675.3), Mnk2(NP_951009.1), and Akt1(NP_001014431.1).

