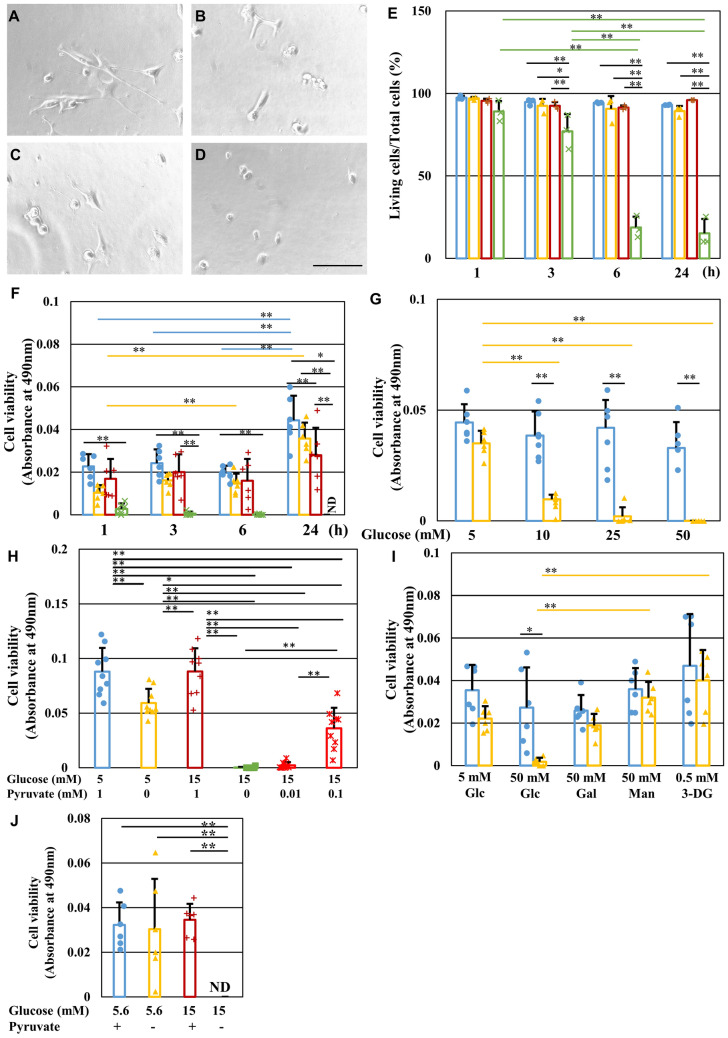
Figure 1.
Pyruvate starvation induces rapid IMS32 Schwann cell death under high-glucose conditions. (A–D) Representative phase-contrast micrographs of IMS32 cells at 24 h in the [Glc 5 mM/Pyr ( +)] (A), [Glc 5 mM/Pyr (−)] (B), [Glc 50 mM/Pyr (+)] (C), and [Glc 50 mM/Pyr (−)] (D) groups. Scale bar represents 100 μm. (E and F) IMS32 cell viability at 1, 3, 6, and 24 h in the [Glc 5 mM/Pyr (+)] (blue), [Glc 5 mM/Pyr (−)] (yellow), [Glc 50 mM/Pyr (+)] (brown), and [Glc 50 mM/Pyr (−)] (green) groups was determined by Trypan blue staining (E) and MTS assay (F). (G and I) Cell viability at 24 h after exposure to 5, 10, 25, or 50 mM glucose (G) or 50 mM galactose, 50 mM mannitol or 0.5 mM 3-deoxyglucosone (I) in the presence (blue) or absence (yellow) of pyruvate was determined by MTS assay. (H) Cell viability at 24 h after exposure to [Glc 5 mM/Pyr 1 mM] (blue), [Glc 5 mM/Pyr (−)] (yellow), [Glc 15 mM/Pyr 1 mM] (brown), [Glc 15 mM/Pyr (−)] (green), and [Glc 15 mM/ Pyr 0.01 or 0.1 mM] (red) groups was determined by MTS assay. (J) Cell viability at 6 h after exposure to [Glc 5 mM/Pyr (+)] (blue), [Glc 5 mM/Pyr (−)] (yellow), [Glc 15 mM/Pyr (+)] (brown), and [Glc 15 mM/Pyr (−)] (green) in Tyrode’s solution with N2 supplement was determined. Values represent mean + SD from three (E), six (F, G, I, J) and nine (H) experiments (individual values are depicted as circles, triangles, pluses and crosses). * P < 0.05, ** P < 0.01. Glc, glucose; Gal, galactose; Man. Mannitol; 3-DG, 3-deoxyglucosone.

