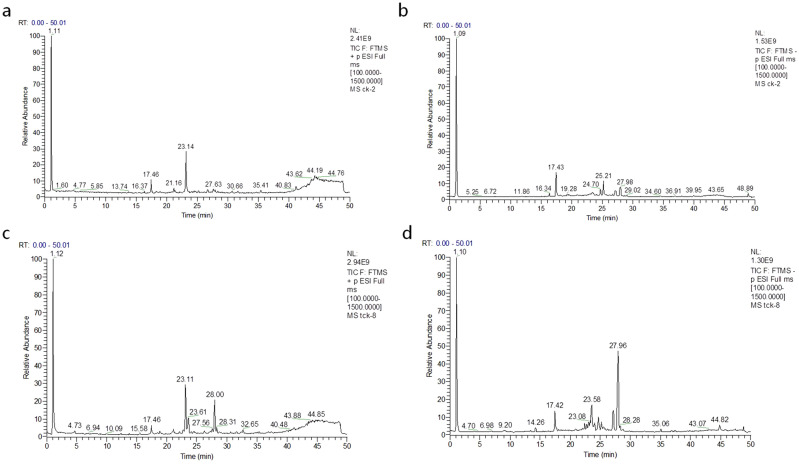
Figure 1.
LC–MS chromatograms of the wheat grain metabolites (X-axis = time and Y-axis = response. (a) Relative abundance of positive ions at different time intervals for control. (b) Relative abundance of negative ions at different time intervals for control. (c) Relative abundance of positive ions at different time intervals for infected samples. (d) Relative abundance of negative ions at different time intervals for infected samples.

