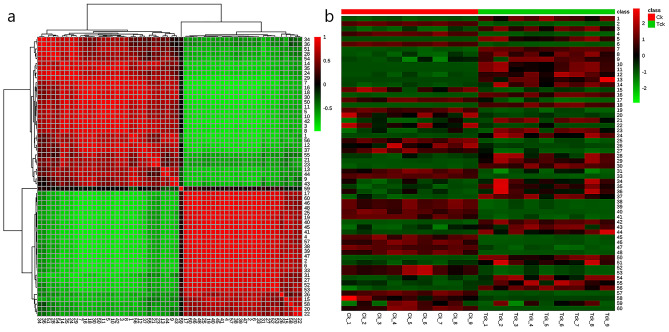
Figure 3.
The hierarchical clustering heatmap visualizing the changes in the contents of potential metabolites in T. controversa-infected and noninfected samples by MetaboAnalyst 5.0 software (https://www.metaboanalyst.ca/faces/ModuleView.xhtml). (a) Correlation analysis of differential metabolites. Deeper colors had stronger correlations, and lighter colors had weaker correlations. (b) Hierarchical cluster analysis of differential metabolites. Red indicates that the contents of the metabolites increased, and blue indicates that the content of the metabolites decreased.

