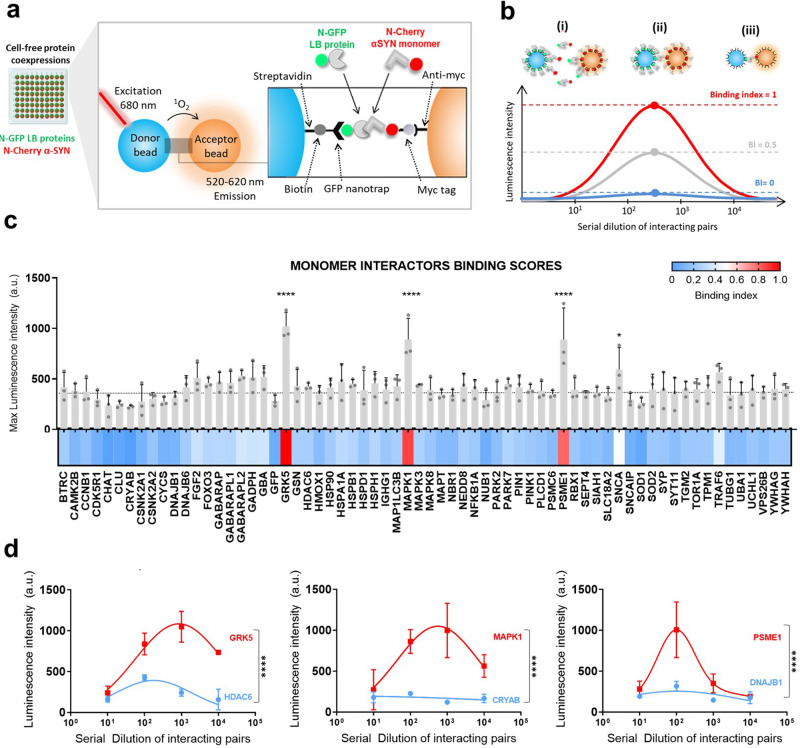
Fig. 2. Interactions between LB proteins and monomeric WT α-SYN.
a All proteins and a GFP control were co-expressed in LTE with N-mCherry-tagged WT α-SYN. LTE was primed with the DNA constructs of each LB protein and α-SYN in a 96-well plate. The donor bead binds the N-GFP-tagged LB protein while the acceptor bead binds to the N-terminal mCherry-myc tag of α-SYN. Upon interaction, the proteins will bring the beads in close proximity with the transfer of a singlet oxygen, leading to signal being emitted at 520–620 nm. b AlphaScreen signal is dependent on the dilution of the protein. An excess of proteins (i) will lead to a low signal by inhibition of bead association through competition with unbound proteins, whereas low concentration leads to limited bead association (iii). A maximum signal is detected when the optimal bead/protein ratio is reached (ii). Maximum luminescence is then converted to a binding index (BI) for each interaction. c Maximum values were plotted as a bar plot, with error bars representing the SEM of the triplicate measurements. Dotted line represents mean + SEM of GFP control. Heatmap represents the BI values. d AlphaScreen curves along the four dilutions. Comparison of signals to those of the GFP control (Dunnett’s multiple comparisons test; ****p ≤ 0.0001, *p ≤ 0.05, n = 3). Error bars = mean ± SEM.

