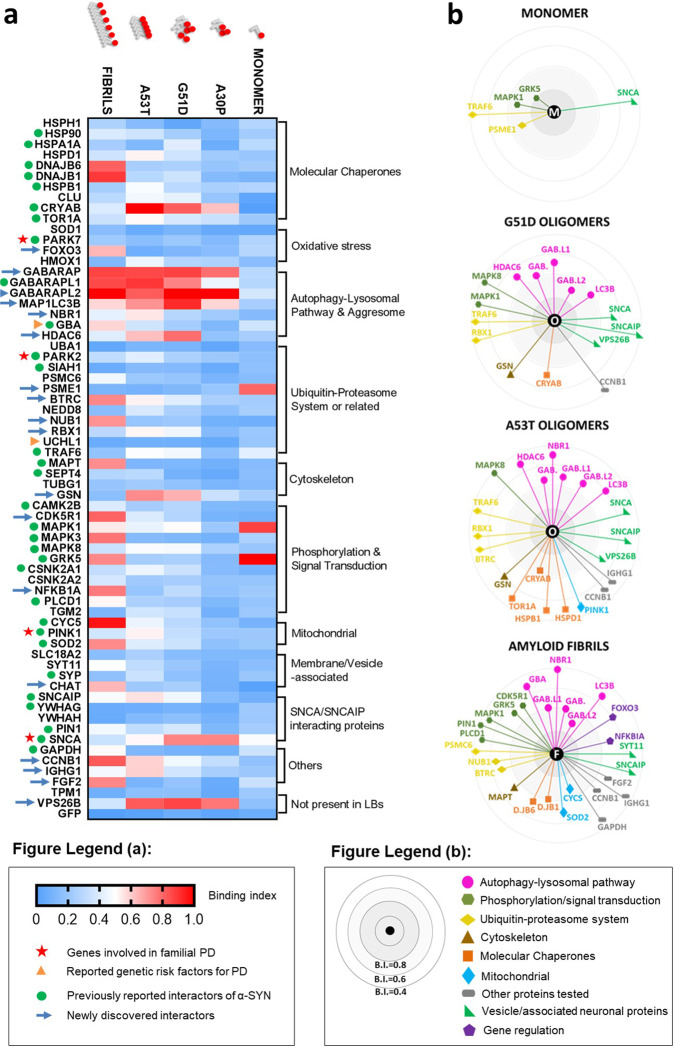
Fig. 7. The interactome of α-synuclein in the Lewy bodies.
a Heatmap of interactions reflects binding indexes, distributed from the highest (BI = 1) to the lowest (BI = 0), based on Association Quotients (Q) from TCCD data and maximum luminescence using AlphaScreen proximity assay. Each colour depicts the average of triplicate measurements of one pairwise interaction with a LB component. Proteins are organized broadly, based on biological process. Previously identified PPIs (as described in BIOGRID) and genetically relevant proteins are highlighted. b Binding indexes allowed for representation of individual interactomes for each species of α-SYN tested (M—monomer, O—G51D/A53T cell-free aggregated species and F—amyloid fibrils). Proteins are grouped by biological process and distance to the centre represents magnitude of binding index.

