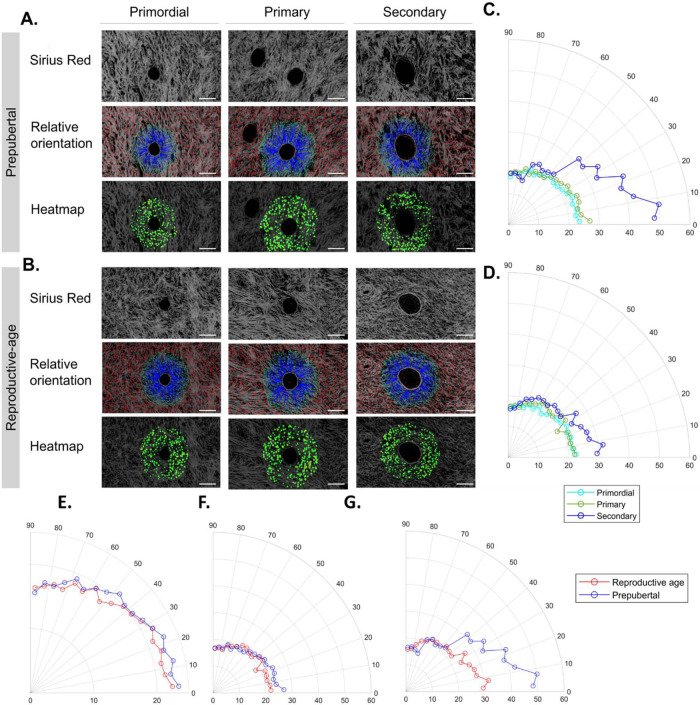
Fig. 4. Fiber orientation in the perifollicular ECM around preantral follicles at prepuberty and reproductive age.
A, B Analysis of fiber orientation around the borders of primordial, primary, and secondary follicles at prepubertal and reproductive age using Sirius Red-stained sections. Details on the number of analyzed fibers and follicles at each stage and age are detailed in Table 1. The blue line associates the center of fibers extracted by CT-FIRE with corresponding boundary locations, while the red line shows fibers located either beyond the distance range or within the boundary; boundaries are highlighted in yellow; the heatmap uses red or warm colors to indicate larger relative angles. C, D Circular plots of fiber orientation frequency during folliculogenesis in prepubertal (C) and reproductive age (D) tissues revealed significant fiber reorientation at the secondary stage compared to primordial and primary stages and at both ovarian ages. One-way ANOVA (post hoc: Tukey) was used to compare fiber directionality between follicle stages within each age group. During prepuberty (p values): Pprimordial–primary = 0.9191; Pprimordial–secondary = 0.0010; and Pprimary–secondary = 0.0034. During reproductive age (p values): Pprimordial–primary = 0.8574; Pprimordial–secondary = 0.0022; and Pprimary–secondary = 0.0099. E–G When comparing the difference in fiber orientation around follicles from prepubertal and reproductive-age tissues at each follicular stage (E: primordial, F: primary, and G: secondary), we found significant differences between age groups at all stages. Pprimordial = 0.0026; Pprimary = 0.0329; and Psecondary < 0.0001. One-tailed t test was used to compare fiber directionality around follicles at the same stage between age groups. Scale: 200 µm.

