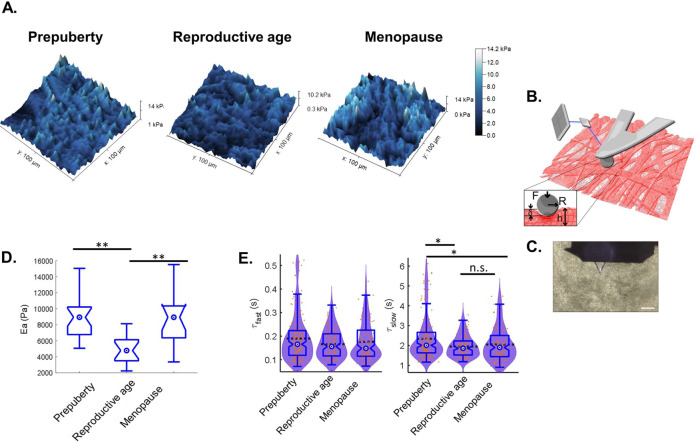
Fig. 5. Elasticity and viscoelasticity of human ovarian tissue.
A 3D rendering of AFM maps such as surface height and color reflects Young’s modulus amplitude measured using a Hertzian model. B Graphic representation of a Hertzian model and AFM measurement of ovarian tissue deformation under AFM spherical probe indentation: R is the probe radius (2.5 µm), F is the applied force, δ is the indentation, and h is tissue thickness (50 µm). Deformation induces cantilever deflection. An optical system using a laser to detect the tip’s deflection helped to measure Young’s modulus using the Hertzian model. C Transmission microscopic image of the AFM cantilever positioned on top of ovarian tissue in PBS. Scale: 100 µm. D Elasticity measurements. N = 5 biologically independent samples per age group with at least three analyzed regions per sample. Pprepuberty–reproductive age = 3.471e−5; Pmenopause–reproductive age = 7.619e−4. E Viscoelasticity measurements. Although ovarian tissue shows significant elasticity change upon menopause, no significant difference was recorded in terms of viscoelasticity (λ: relaxation time) between reproductive-age and menopausal tissues. A minimum of six measurements on at least nine different points in a sample were recorded for viscoelasticity, which was measured on the same region that was used for force maps. The graphic shows the overlay of violin plots with boxplots. Statistical significance was obtained using Kruskal–Wallis test followed by Dunn’s multiple comparison correction. Boxplots display 25th and 75th percentile, median (blue circle), and the whiskers extending to the last data point not considered outlier. ns: non-significant; *p < 0.001; **p < 0.0001.

