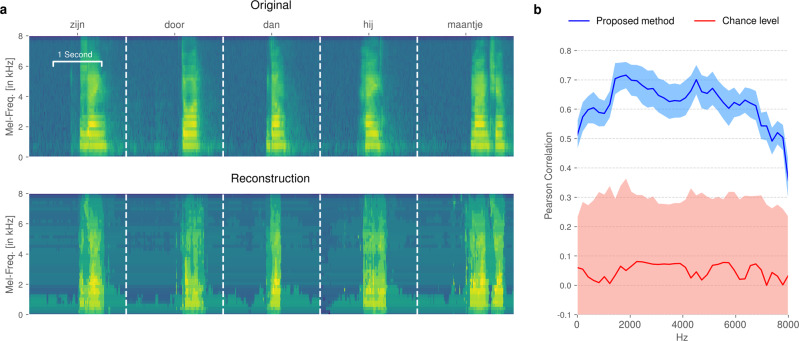
Fig. 3. Decoding performance of the proposed method on the open-loop data from the audible speech experiment.
The spectrogram was reconstructed using ten-fold cross-validation. a Visual comparison of original and reconstructed spectrograms. b Correlation coefficients across all spectral bins for our approach (blue, n1 = 10) compared to a randomized baseline (red, n2 = 100) generated by breaking the temporal alignment between the brain signals and speech recordings. Shaded areas represent standard deviation.

