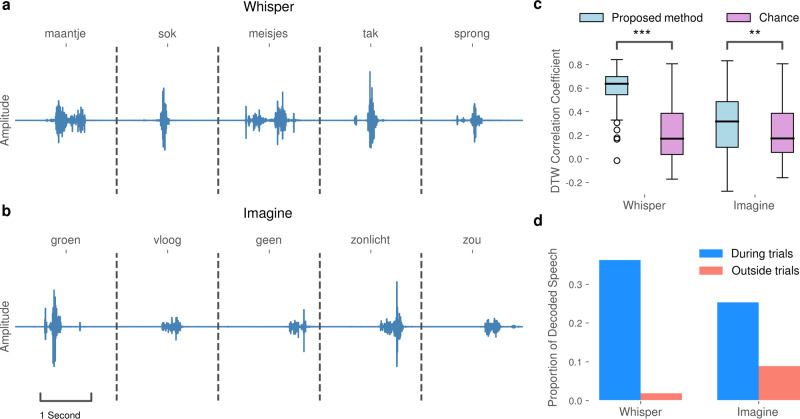
Fig. 4. Decoding results of the proposed method in the closed-loop experimental runs.
a Selected examples of synthesized audio waveforms produced during whispered speech trials. b Selected examples of synthesized audio waveforms produced during imagined speech trials. In both runs, the speech was reliably produced when the participant was prompted to whisper or imagine to speak, respectively. c Pearson correlation coefficients between time-warped reference speech trials and closed-loop whispered trials (n1 = 73) and closed-loop imagined speech trials (n1 = 75), respectively. Chance level (n2 = 1000) is based on randomly selected data from non-speech tasks performed by the participant. Statistical significance, indicated by asterisks (***P < 0.001; **P < 0.01), was computed using Mann–Whitney U tests. Black horizontal lines correspond to median DTW correlations scores. Boxes define boundaries between the first and the third quartile. Error bars present the range of data within 1.5 times the interquartile range, and points beyond the range of the error bars show outliers. d The proportion of decoded and synthesized speech during whispered and imagined trials, respectively, versus non-speech intertrial intervals.

