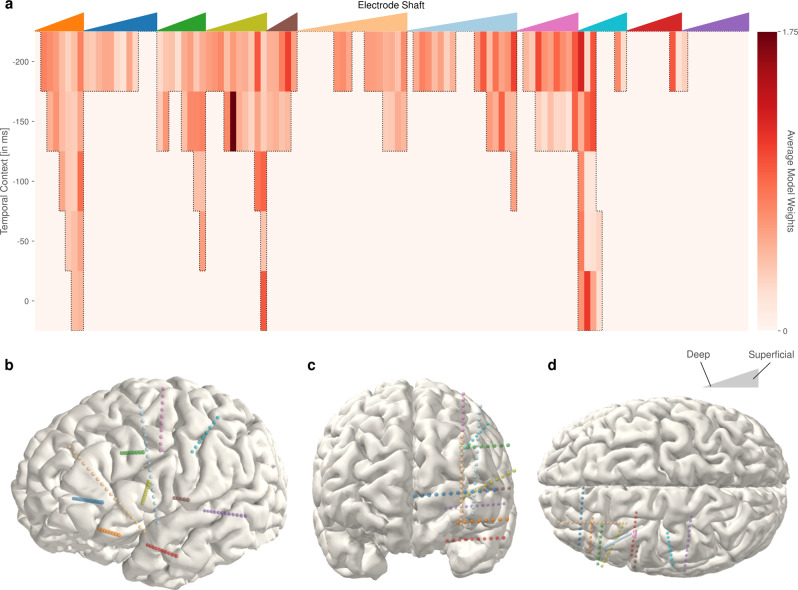
Fig. 5. Anatomical and temporal contributions.
a Spatiotemporal decoder activations averaged across 9 classes and 40 frequency bins. The colored triangles at the top of the panel correspond to the colored electrode shafts in (b–d). The left edge of each triangle represents the deepest contact of a respective colored electrode shaft and the most superficial contact the same shaft is represented at the right edge, with the intermediate contacts ordered longitudinally in between. The activations (i.e., transformed average model weights) for the decoding models at each electrode and temporal lag are indicated by the vertical bars below the corresponding colored triangle. Darker red indicates higher absolute activations. The activations indicate that inferior frontal and middle frontal cortices are predominately employed in decoding. b–d Different views of electrode locations for the participant: b left lateral, c frontal, d superior.

