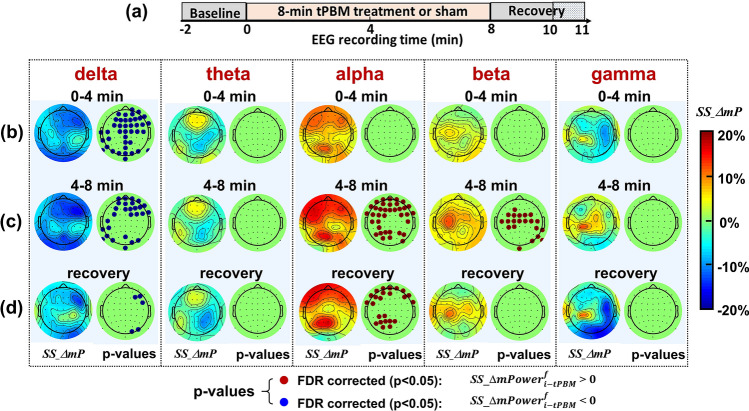
Figure 3.
(a) Outlines the protocol timing: 2-min baseline, 0–4 min and 4–8 min temporal periods for tPBM/sham, and 8–11 min recovery (only 8–10 min used for analysis). (b)–(d) show topographies of group-averaged (n = 46), sham-subtracted ΔmPower (SS_ΔmP) and FDR-corrected p-value maps based on paired permutation tests between SS_ΔmP values under tPBM vs sham conditions during 0–4 min tPBM/sham, 4–8 min tPBM/sham, and 8–10 min recovery, respectively, at five frequency bands. In the p-value maps, the red dots correspond to marking the electrodes where tPBM created significant increases in ΔmPower (FDR corrected p < 0.05) compared to the sham condition (see Eq. (4a)). In contrary, the blue dots with mark the electrodes where tPBM induced significant reduction in ΔmPower (FDR corrected p < 0.05) compared to the sham condition.

