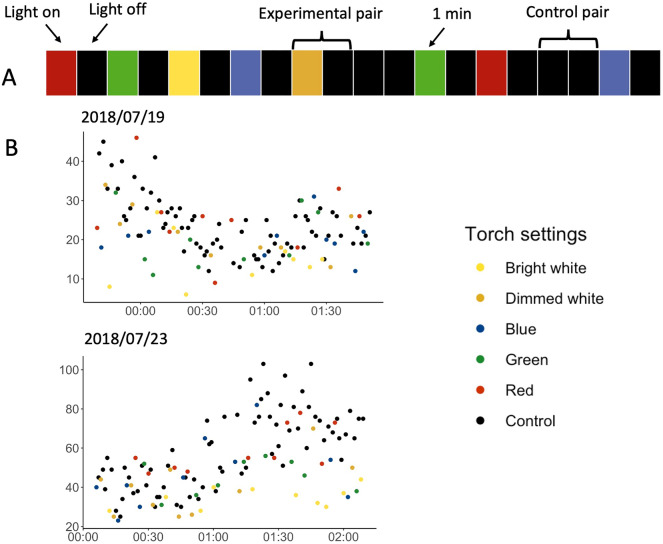
Figure 2.
(A) Visualisation of an example of treatment series of the spectra experiment, with consecutive 1-min segments (rectangles on the figure) with the torch on and off. Each experimental pair (‘light-on’, ‘light-off’) has a coloured segment corresponding to one of five different settings (‘red’, ‘green’, ‘blue’, ‘dimmed white’ and ‘bright white’) followed by a black segment representing the light off. Two black segments indicate a control pair (‘light-off’, ‘light-off’). (B) Two example days of the spectra experiment undertaken at the Farm (19th July 2018 starting at 23:40BST) and on the Neck (23rd July 2018 at 00:07BST). They show the count of birds per minute against time. Different colours of dots represent various settings.

