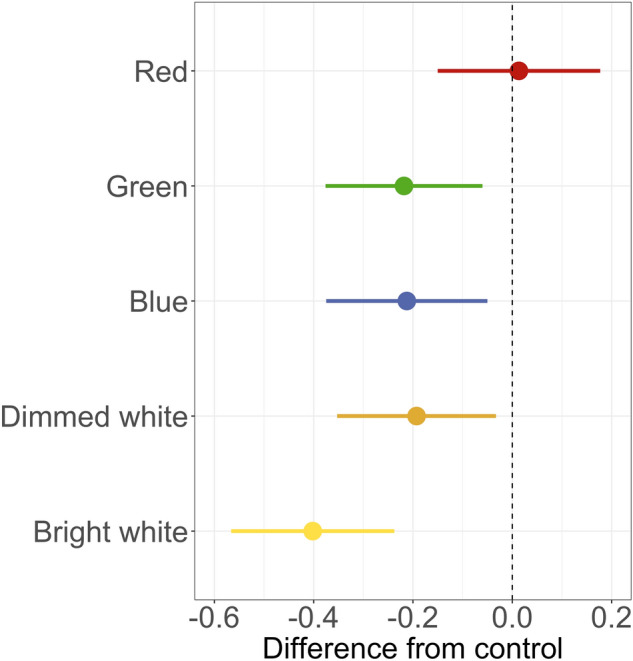
Figure 3.

Results of post-hoc tests in the spectra experiment. The graph shows the estimated coefficients and 95% confidence interval of five experimental pairs when comparing the difference in ‘light-on’ vs ‘light-off’ to the control (‘light-off’ vs ‘light-off’, dashed vertical line). All the colours except red significantly reduced bird counts, with lower numbers of birds recorded when the light was on. For detailed statistics, see Table 1.
