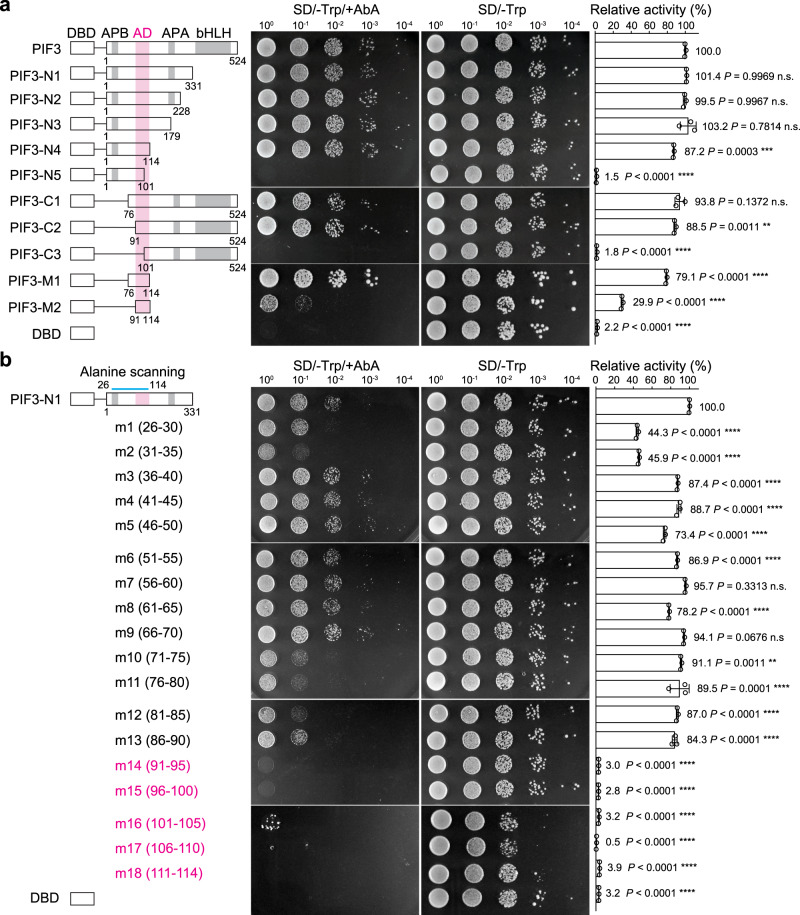
Fig. 1. The aa91-114 region confers PIF3’s AD activity in yeast.
a Full-length and a series of truncation fragments of PIF3 were fused to the Gal4 DNA binding domain (DBD) as shown in the schematics, using the bait vector of the yeast two-hybrid system, and were evaluated for their transactivation activity in yeast. The magenta column highlights the aa91-114 region. APB, active PHYB binding motif; APA, active PHYA binding motif. b Identification of the residues necessary for PIF3’s AD activity via alanine scanning mutagenesis. A series of alanine-scanning mutants (m1–m18) were generated between amino acids 26 and 114 (indicated by the blue line) in the PIF3-N1 construct. The range of the alanine-substituted amino acids for each mutant is shown in parentheses. The mutants that lost their transactivation activity are shown in magenta. a, b The middle panel shows serial dilutions of the yeast strains containing the respective constructs grown on either SD/-Trp/+AbA or SD/-Trp (control) media. The right panel shows the relative transactivation activities quantified using the yeast liquid β-galactosidase assay. The transactivation activities were calculated relative to that of either PIF3 (a) or PIF3-N1 (b). DBD alone was used as a negative control. Error bars represent the s.d. of three biological replicates; the centers of the error bars represent the mean values. The numbers represent the mean value of the relative activity. The statistical significance of the changes between the sample and the control, PIF3 in a or PIF3-N1 in b, was analyzed by one-way ANOVA (Dunnett’s test, *P ≤ 0.05, **P ≤ 0.01, ***P ≤ 0.001, ****P ≤ 0.0001, n.s. indicates no significant difference). The source data underlying the yeast liquid β-galactosidase assays in (a) and (b) are provided in the Source data file.

