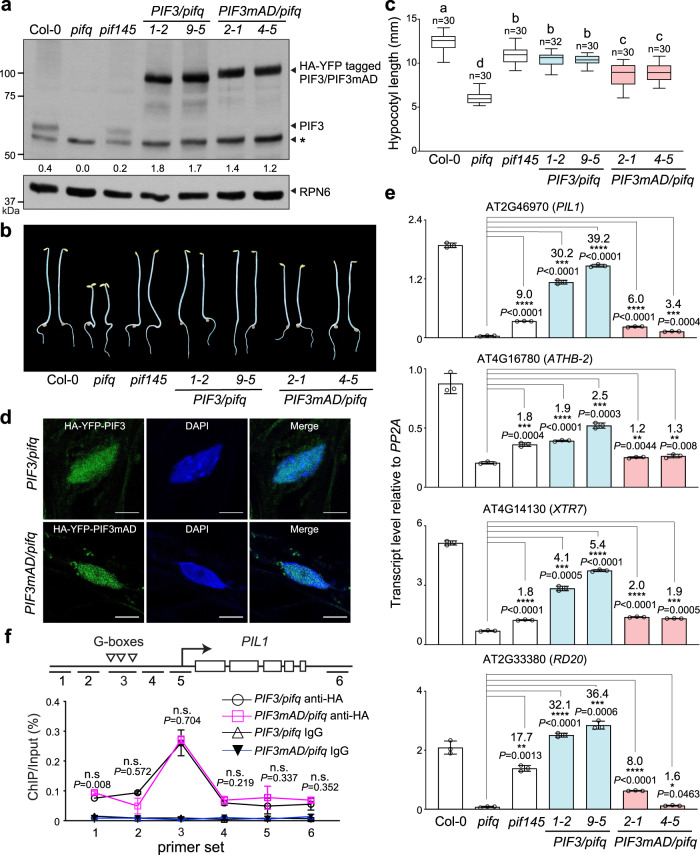
Fig. 4. PIF3mAD compromises PIF3’s functions in skotomorphogenesis.
a Immunoblots showing the steady-state levels of endogenous PIF3, or HA-YFP-PIF3 and HA-YFP-PIF3mAD in dark-grown seedlings of Col-0, pifq, pif145, PIF3/pifq (1-2 and 9-5), and PIF3mAD/pifq (2-1 and 4-5) using anti-PIF3 antibodies. RPN6 was used as a loading control. The numbers beneath the PIF3 immunoblot indicate the relative levels of PIF3 or HA-YFP tagged PIF3 normalized to RPN6. The asterisk indicates non-specific bands. The immunoblot experiments were independently repeated at least three times, and the results of one representative experiment are shown. b Images of representative 4-d-old dark-grown seedlings of Col-0, pifq, and the transgenic PIF3/pifq and PIF3mAD/pifq lines. c Hypocotyl length measurements of the lines shown in (b). The boxes represent from the 25th to 75th percentile; the bars are equal to the median values; the whiskers extend to the maximum and minimum data points. Samples labeled with different letters exhibited statistically significant differences (ANOVA, Tukey’s HSD, P ≤ 0.05). d Confocal images showing the nuclear localization of HA-YFP-PIF3 and HA-YFP-PIF3mAD in hypocotyl epidermal cells of 4-d-old dark-grown PIF3/pifq (line 1-2) and PIF3mAD/pifq (line 2-1) seedlings. Nuclei were stained with DAPI. Scale bars represent 5 μm. e qRT-PCR results showing the steady-state transcript levels of select PIF3 target genes in seedlings described in (b). The transcript levels were calculated relative to those of PP2A. Error bars represent the s.d. of three biological replicates. The centers of the error bars represent the mean values. Numbers indicate fold changes relative to pifq; the statistical significance was analyzed using two-tailed Student’s t-test (*P ≤ 0.05, **P ≤ 0.01, ***P ≤ 0.001, ****P ≤ 0.0001). f ChIP assays showing the binding of HA-YFP-PIF3 and HA-YFP-PIF3mAD to the G-box elements in the enhancer region of PIL1, as illustrated in the schematics. The ChIP experiments were performed using 4-d-old dark-grown PIF3/pifq (line 1-2) and PIF3mAD/pifq (line 2-1) seedlings with anti-HA antibodies. Immunoprecipitated DNA was quantified via real-time PCR using primer sets for locations 1 to 6 at the PIL1 locus. ChIP with rabbit IgG was used as a negative control. Error bars represent the s.d. of three biological replicates. The centers of the error bars represent the mean values. The statistical significance was analyzed using two-tailed Student’s t-test. n.s. indicates either the values between the PIF3/pifq and PIF3mAD/pifq samples are not significantly different or the difference is <1.5-fold. The source data underlying the immunoblots in (a), hypocotyl measurements in (b), qRT-PCR data in (e), and ChIP data in (f) are provided in the Source data file.

