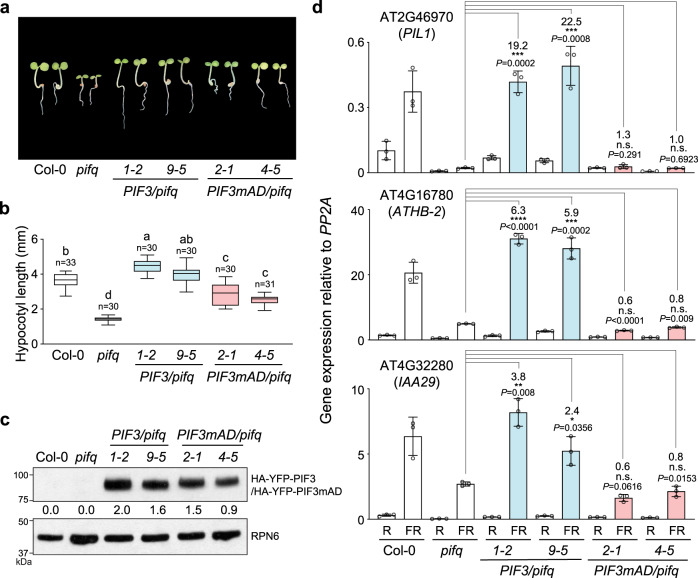
Fig. 6. PIF3’s AD participates in gene activation by shade.
a Images of representative 4-d-old seedlings of Col-0, pifq, two PIF3/pifq lines, and two PIF3mAD/pifq lines grown in 10 μmol m−2 s−1 R light. b Hypocotyl length measurements of the lines shown in (a). The boxes represent the 25th to 75th percentiles; the bars are equal to the median values; the whiskers extend to the maximum and minimum data points. Samples labeled with different letters exhibited statistically significant differences in hypocotyl length (ANOVA, Tukey’s HSD, P ≤ 0.05). c Immunoblots showing the steady-state levels of HA-YFP-PIF3 or HA-YFP-PIF3mAD in the PIF3/pifq and PIF3mAD/pifq seedlings shown in (a) using anti-HA antibodies. RPN6 was used as a loading control. The immunoblot experiments were independently repeated at least three times, and the results of one representative experiment are shown. The numbers beneath the immunoblot indicate the relative levels of HA-YFP-PIF3 or HA-YFP-PIF3mAD normalized to RPN6. d qRT-PCR results showing the steady-state transcript levels of select PIF3 target genes in 4-d-old R-light-grown seedlings of Col-0, pifq, and the PIF3/pifq and PIF3mAD/pifq lines before (R) and after a 1-h FR treatment (FR). The transcript levels were calculated relative to those of PP2A. Error bars represent the s.d. of three biological replicates. The centers of the error bars represent the mean values. Numbers indicate fold changes relative to pifq; the statistical significance was analyzed using two-tailed Student’s t-test (*P ≤ 0.05, **P ≤ 0.01, ***P ≤ 0.001, ****P ≤ 0.0001); n.s. indicates the difference was either <2-fold or not statistically significant. The source data underlying the immunoblots in (c) and qRT-PCR data in (d) are provided in the Source data file.

