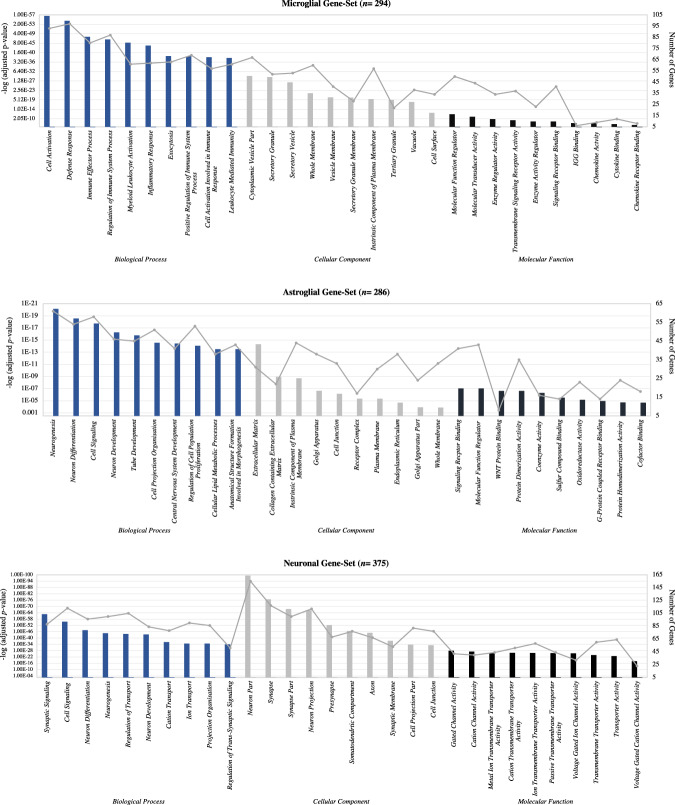
Fig. 1. Gene ontology enrichment analysis.
GO enrichment analysis for the top ten biological processes (BPs), cellular components (CCs) and molecular functions (MFs) of the microglial, neuronal and astroglial gene-sets. Analyses indicated that these gene-sets were good representations of each cell types specific functioning. The line plot displays the numbers of differentially expressed genes in each specific function. The bar plot displays the adjusted p values (FDR (false discovery rate) < 0.05).

