Figure 1.
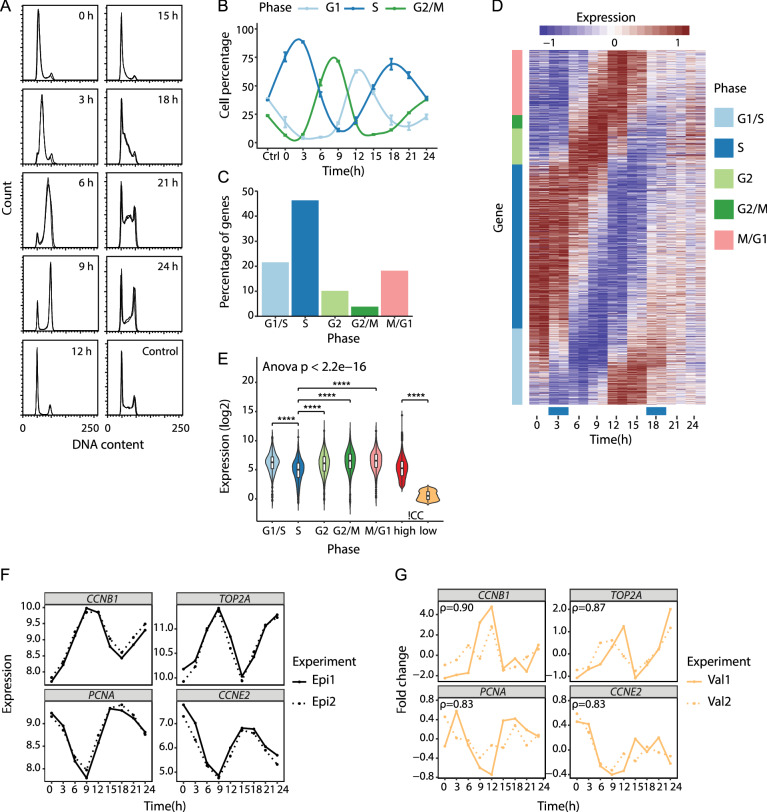
Total RNA-seq of synchronized HaCaT cells identifies cyclic gene expression patterns. (A) HaCaT cells were synchronized by double thymidine block in two independent experiments (Epi1, Epi2) and cell synchrony was monitored by flow cytometry of propidium iodide-stained cells. The figure shows superimposed DNA content profiles of the two replicate experiments for each time point. Horizontal axes show DNA content (arbitrary units) and vertical axes show the number of cells with the corresponding DNA content. Control is unsynchronized cells. (B) Percentage of cells assigned to G1, S, and G2/M phases for each of the time points analyzed. Values and error bars are averages and standard deviations (n = 2). (C) Percentage of cell cycle genes assigned to G1/S (21.5%), S (46.3%), G2 (10.1%), G2/M (3.8%), and M/G1 (18.2%) phases. (D) Heatmap showing the expression changes of the cell cycle genes relative to their median expression. Colour bars in the gene margin (y axis) show the genes’ assigned cell cycle phase; blue bars above the time points (x axis) show the time points having the highest percentage of S phase cells. (E) Distribution of the genes’ average RNA-seq expression for cell cycle genes in G1/S (n = 388), S (n = 835), G2 (n = 183), G2/M (n = 68), and M/G1 (n = 329) phases. ****p ≤ 0.0001 (Welch’s t-test, p-values for each phase group against S phase were Bonferroni corrected for multiple testing). (F) RNA-seq profiles for cell cycle genes CCNB1, CCNE2, PCNA, and TOP2A. (G) Relative expression profiles for CCNB1, CCNE2, PCNA, and TOP2A as measured by RT-qPCR in two new biological replicates (Val1, Val2; Figure S3). Spearman's correlation coefficients (ρ) were calculated based on the mean RNA-seq expression per time point (Epi1, Epi2) and mean RT-qPCR fold change per time point (Val1, Val2).

