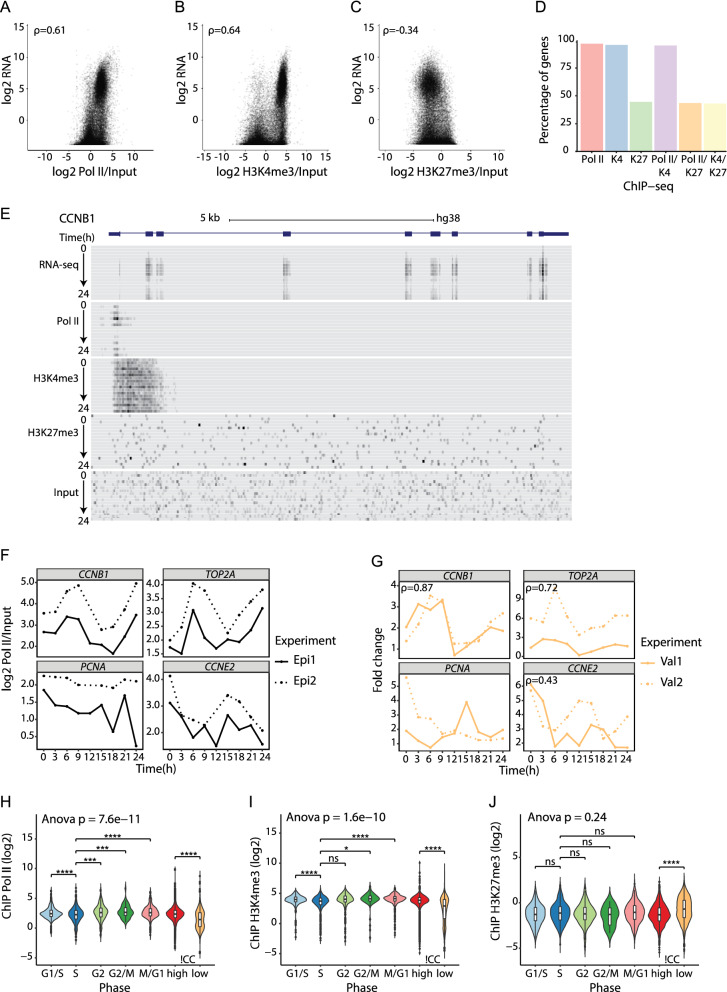
Figure 2.
ChIP-seq of synchronized HaCaT cells identifies dynamic H3K4me3, H3K27me3, and Pol II changes during cell cycle. (A–C) Average RNA-seq expression (genes expressed > 0) plotted against average (A) Pol II (n = 30,744), (B) H3K4m3 (n = 30,729), and (C) H3K27me3 (n = 30,732) ChIP-seq signal normalized against input. Values are Spearman's correlation coefficients (ρ). (D) Percentage of cell cycle gene promoters containing Pol II, H3K4me3 (K4), or H3K27me3 (K27) marks and combined Pol II/K4, Pol II/K27, or bivalent K4/K27 marks. (E) The UCSC Genome browser (GRCh38/hg38) view of RNA-seq, Pol II, H3K4me3, H3K27me3, and input ChIP-seq data at the CCNB1 (NM_031966) gene locus. (F) Pol II ChIP-seq profiles for cell cycle genes CCNB1, CCNE2, PCNA, and TOP2A. (G) Biological validation of Pol II ChIP-seq data for CCNB1, CCNE2, PCNA, and TOP2A. Spearman's correlation coefficients (ρ) were calculated based on the mean Pol II ChIP-seq signal per time point (Epi1, Epi2) and mean Pol II ChIP-qPCR fold change per time point from the new biological replicates (Val1, Val2; Figure S3). (H–J) Distribution of the genes’ average (H) Pol II (n = 1737), (I) H3K4me3 (n = 1726), and (J) H3K27me3 (n = 802) ChIP-seq signal (normalized against input) for cell cycle genes in G1/S, S, G2, G2/M, and M/G1 phases. ns p > 0.05, *p ≤ 0.05; **p ≤ 0.01, ***p ≤ 0.001, ****p ≤ 0.0001 (Welch’s t-test, p-values for each phase group against S phase were Bonferroni corrected for multiple testing).

