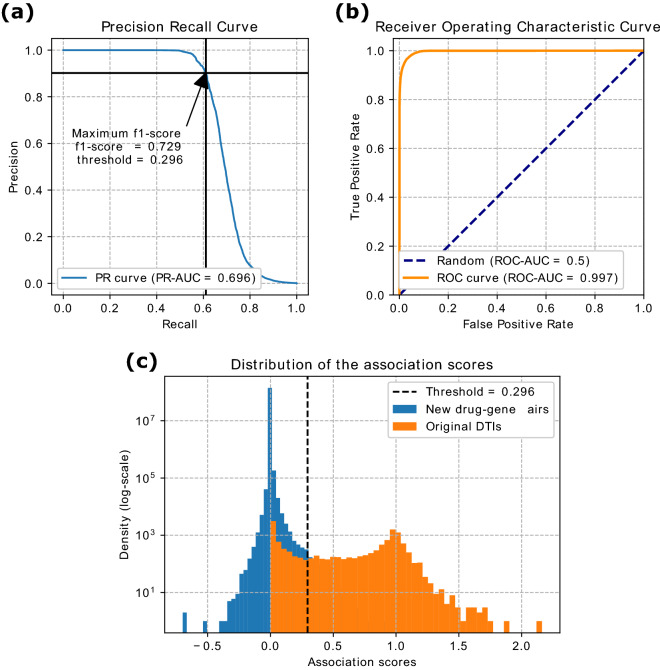
Figure 2.
Prediction of new DTIs. (a) Precision-Recall (PR) and (b) Receiver Operating Characteristic (ROC) curves for assessing the ability of the framework to capture the known drug–target interactions accurately. AUC area under the curve. (c) Distribution of the association scores of the reconstructed matrix, for the input DTIs (orange) and the new drug–gene pairs obtained by the matrix completion property of GNMTF (blue). New drug–gene pairs on the right side of the threshold (dashed line) were considered to be newly predicted DTIs.

