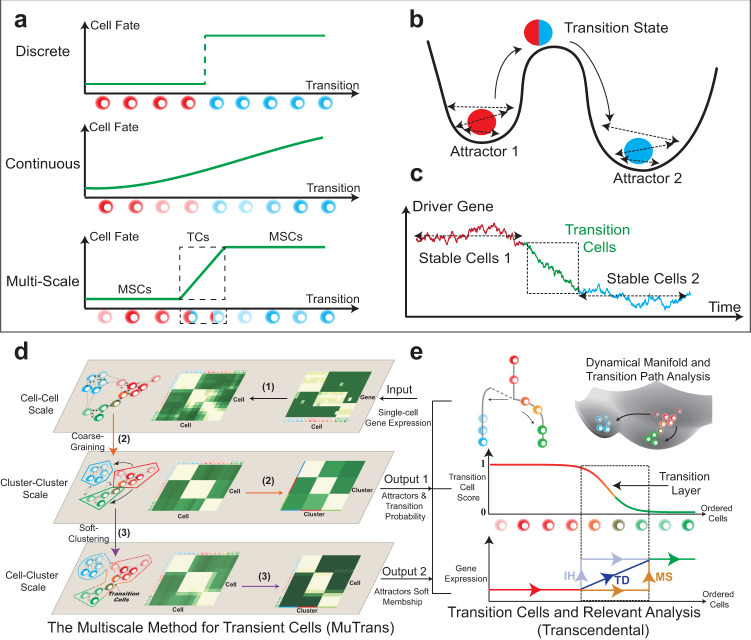
Fig. 1. Brief introduction to MuTrans.
a–c Theoretical foundation of MuTrans - the multi-scale stochastic dynamics approach to model cell-fate transitions. a Three possible perspectives to describe cell-fate transition, as either entirely discrete or continuous process, or as the multi-scale switch process between attractors mediated by transition cells. The first two perspectives correspond to clustering or pseudotime ordering commonly adopted in single-cell analysis. b Biophysical foundation of the multi-scale perspective to treat cell-fate transition as over-damped Langevin dynamics in the multi-stable potential wells. The stable states correspond to the attractor basins while the transition states are modelled by the saddle points of underlying dynamical system. c A typical gene expression trajectory of multi-scale dynamics. The expression of driver genes fluctuates within the stable cells, while witnesses the continuous yet temporary change within transition cells, forming a transition layer in trajectory. d, e The procedure and downstream analysis of MuTrans. d The procedure of iterative multi-scale learning. The input is the pre-processed single-cell gene expression matrix. The three major steps (indicated by the number on arrow) for iterative learning of the stochastic dynamics across three different scales: (1) learning the cell-cell scale random walk transition probability matrix (rwTPM) from expression data, (2) learning the cluster-cluster scale rwTPM by coarse-graining the cell-cell scale rwTPM, and (3) learning the cell-cluster scale rwTPM by soft-clustering the cluster-cluster scale rwTPM. The output of iterative multi-scale learning includes the cell attractor basins and their mutual transition probabilities, as well as the membership matrix indicating relative cell positions in different attractors. e Downstream analysis (Transcendental Procedure). Given the output of iterative multi-scale learning, MuTrans constructs the cell lineage, dynamical manifold and transition paths manifesting the underlying transition dynamics of cell-fate. For each state-transition process, MuTrans explicitly distinguishes between stable and transition cells via transition cell score (TCS). The transition cells are marked with dashed squares. Based on the TCS ordering of cells, MuTrans identifies three types of genes (MS, IH and TD) during the transition whose expression dynamics differ in stable and transition cells. MS: meta-stable genes. IH: intermediate-hybrid genes. TD: transition-driver genes.

