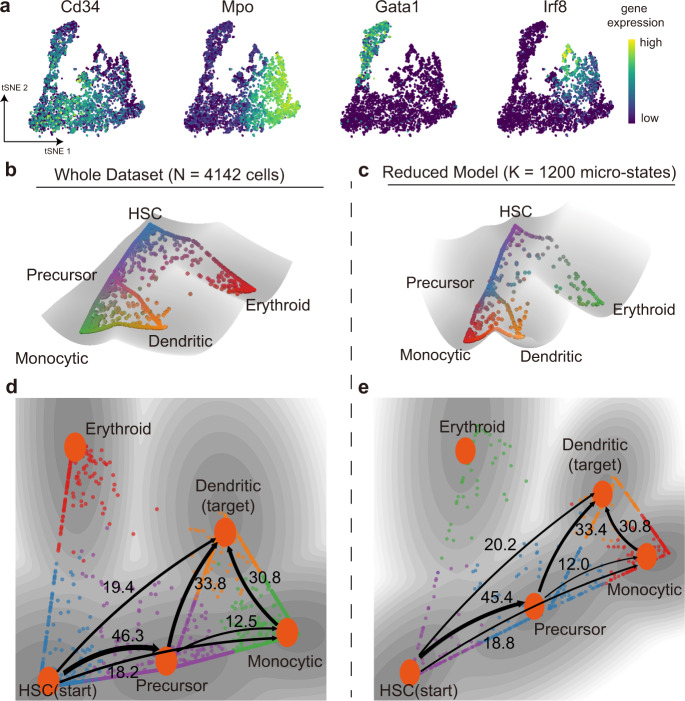
Fig. 6. Application to a large dataset using multiscale reduction approach.
a The tSNE plot and marker gene expression of datasets from early human HSC differentiation in bone marrow. b, c The dynamical manifold constructed from complete dataset (b, N = 4,142 cells) and with DECLARE pre-processing (c, K = 1,200 micro-states) with cells colored by soft clustering membership in MuTrans attractors. In (b) each ball represents one cell and in (c) each ball represents one micro-state. The reduced model preserves the overall structure of dynamical manifold. HSC: hematopoietic stem cells. d, e The transition paths analysis conducted on complete data (d) and with DECLARE pre-processing (e), where HSC are picked as the start and dendritic cells as the target. The numbers indicate the relative likelihood of each transition path, suggesting the quantitative consistency of reduced model with the analysis on whole dataset. Cells are colored by MuTrans attractors. The grayness indicates energy values of dynamical manifold, with darker color representing lower energy values.

