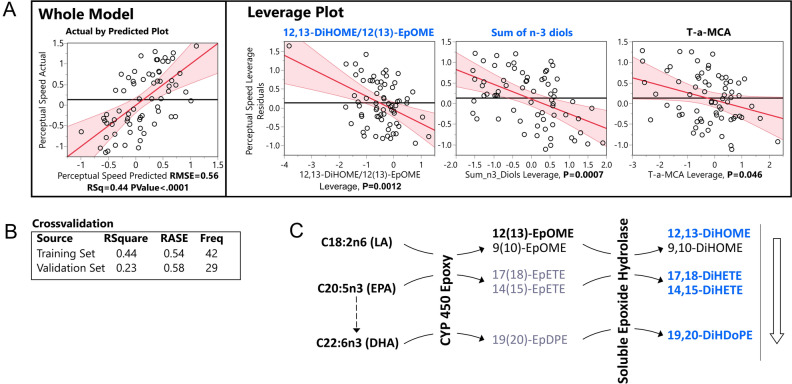
Figure 3.
Least square regression model of perceptual speed. (A) Actual by predicted plot of a whole model and leverage plots of model components. (B) Model cross-validation statistics using training set (60%, n = 44) and validation set (40%, n = 33). (C) Model components of soluble epoxide hydrolase metabolism projected onto their metabolic pathway. Metabolic pathway starts with the fatty acids on the left, farther, metabolizing enzymes are indicated on the arrows. Multiple possible metabolites of the pathway are indicated. Metabolites of sEH used for the model are highlighted. Color of the metabolites as well as an arrow next to the metabolic pathway represents directionality of the correlation with perceptual speed (orange—positive, blue—negative). RMSE root mean squared error, LA linoleic acid, CYP 450 cytochrome p450, sEH soluble epoxide hydrolase, EpOME epoxy octadecanoic acid, DiHOME dihydroxy octadecanoic acid, EpETE epoxy eicosatrienoic acid, DiHETE dihydroxy eicosatrienoic acid, EpDPE epoxy docosapentaenoic acid, DiHDoPE dihydroxy docosapentaenoic acid.

