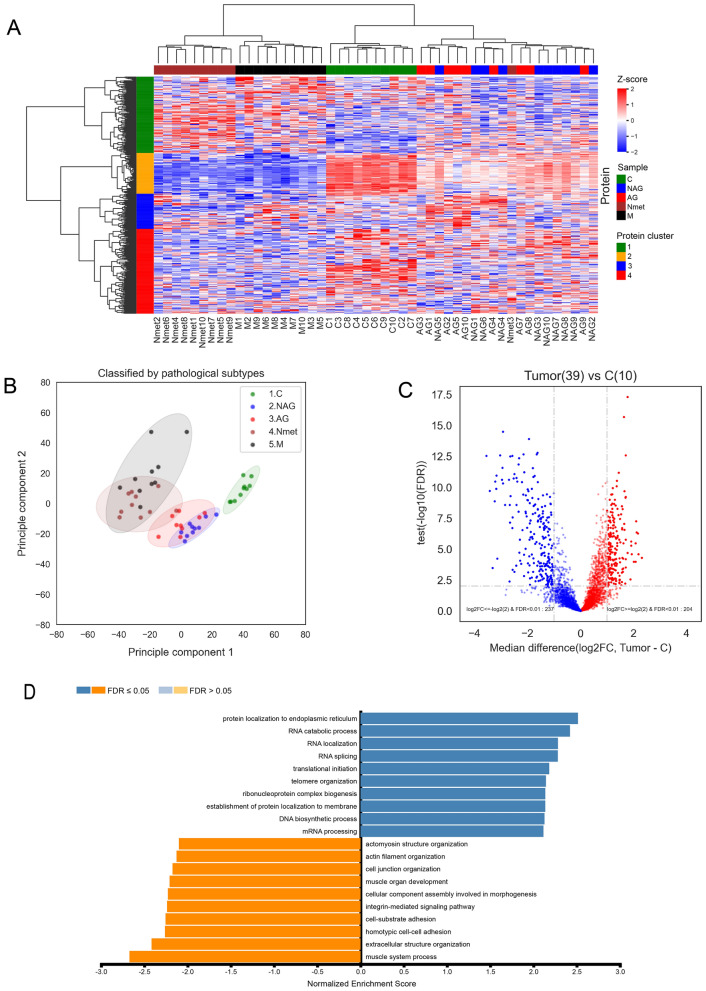
Figure 2.
SWATH-MS analysis of PCa. (A) non-supervised hierarchical clustering of top 500 most variant proteins. Sample types were annotated by colors beyond the heat map as: NAG (blue), AG (red), Nmet (brown), M (black) and C (green). Protein clusters were labelled by colors on the left side of the heat map as: cluster 1 (green), cluster 2 (orange), cluster 3 (blue), and cluster 4 (red). (B) PCA analysis. (C) Volcano plot of significantly expressed proteins in tumors (NAG, AG, Nmet, and M groups) and controls C. (D) Gene set enrichment analysis (GSEA) of differentially expressed proteins based on biological process terms in the gene ontology database accessed via WebGestalt.

