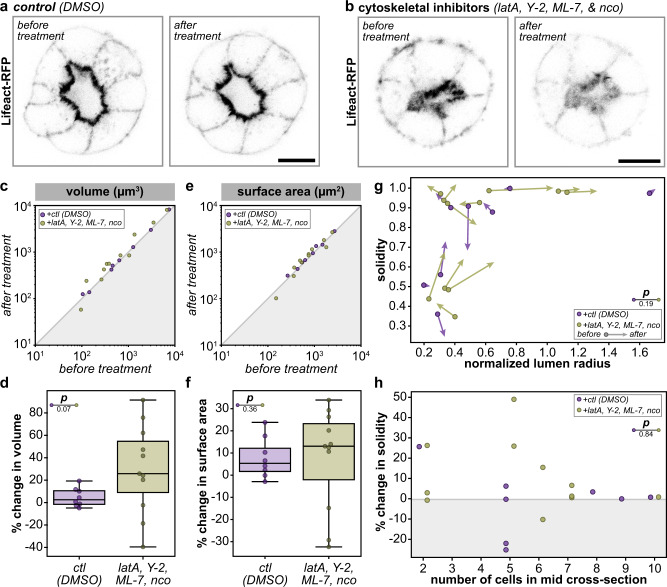
Fig. 3. Acute cytoskeletal ablation does not significantly alter lumen shape.
a Representative single-plane images MDCK spheroids expressing Lifeact-RFP 2 min before (left) and 18 min after (right) addition of DMSO vehicle control. b Representative single-plane images MDCK spheroids expressing Lifeact-RFP 2 min before (left) and 18 min after (right) treatment with a cytoskeletal inhibitor cocktail (latrunculin A (latA), Y-27632 (Y-2), ML-7, and nocodazole (nco)). c Log–log plot of lumen volume before and after treatment (two-sided rank-sum test DMSO-cytoskeletal inhibitors p = 0.13, two-sided Wilcoxon signed rank test t−2 min − t+18 min(DMSO) p = 0.263, t−2 min − t+18 min(cytoskeletal inhibitors) p = 0.041). d Percent change in lumen volume in response to treatment (p-value from two-sided rank-sum test on percent change volume). e Log–log plot of lumen surface area before and after treatment (two-sided rank-sum test DMSO-cytoskeletal inhibitors p = 0.41, two-sided Wilcoxon signed rank test t−2 min − t+18 min(DMSO) p = 0.069, t−2 min − t+18 min(cytoskeletal inhibitors) p = 0.091). f Percent change in lumen surface area in response to treatment (p-value from two-sided rank-sum test on percent change surface area). g Lumen solidity plotted before (arrow end) and after (arrowhead) treatment with DMSO vehicle control (purple) or cytoskeletal inhibitor cocktail (green) as a function of normalized lumen radius (p-value from two-sided 2D Kolmogorov–Smirnov test). h Percent change in lumen solidity plotted as a function of numbers of cells in spheroid mid cross-section (p-values from two-sided 2D Kolmogorov–Smirnov test). Scale bars are 10 µm. For plots c–h, n = 8 and 11 spheroids for DMSO and cytoskeletal inhibitors conditions, respectively. Source data are provided in the Source Data file.

