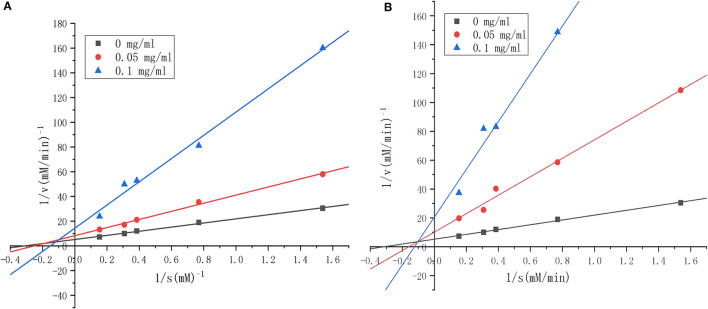
Figure 8.
Lineweaver–Burk plots of angiotensin I-converting enzyme (ACE) inhibition by different concentrations of synthesized RWLE peptides across varying substrate concentrations (0–0.1 mg/ml). (A) Lineweaver–Burk plots of peptide H5 and (B) Lineweaver–Burk plots of peptide H6. V = initial rate of reaction [ΔA228 (nm)/min].

