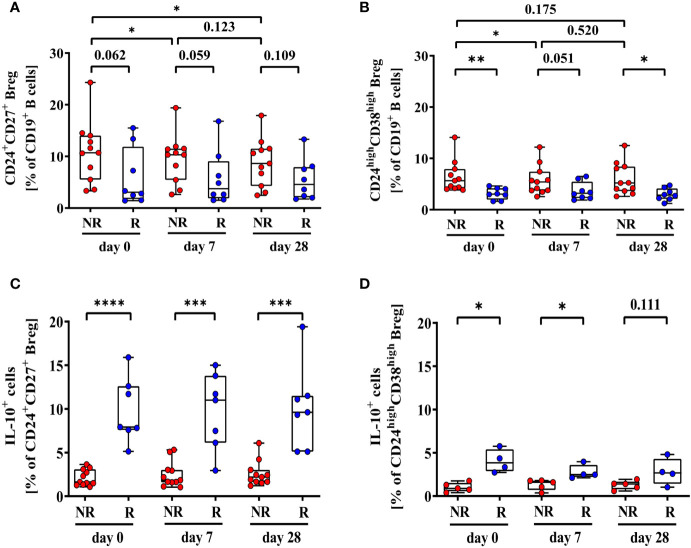
Figure 2.
Frequencies of CD24+CD27+ (A), CD24highCD38high (B), CD24+CD27+IL-10+ (C), and CD24highCD38highIL-10+ Breg (D) of second-generation hepatitis B vaccine non-responders and responders. Depicted are (CpG+P/I)-induced frequencies of CD24+CD27+ (A), CD24highCD38high (B), CD24+CD27+IL-10+ (C), and CD24highCD38highIL-10+ Breg (D) of second-generation hepatitis B vaccine non-responders (NR, red circles, n = 11) and second-generation hepatitis B vaccine responders (R, blue circles, n = 8) before (day 0) and 7, and 28 days after vaccination with a third- (NR group) or second- (R group) generation hepatitis B vaccine, respectively. The boxes show the median and the 25th and 75th percentile. Whiskers indicate the highest and lowest values. Statistical analyses are based either on unpaired Mann-Whitney U tests for the analysis of the NR vs. the R group or on Friedman tests with post Wilcoxon signed rank testing for analysis of the impact of third- and second-generation hepatitis B vaccines within the NR or R group. *p < 0.05; **p < 0.01; ***p < 0.001; ****p < 0.0001.

