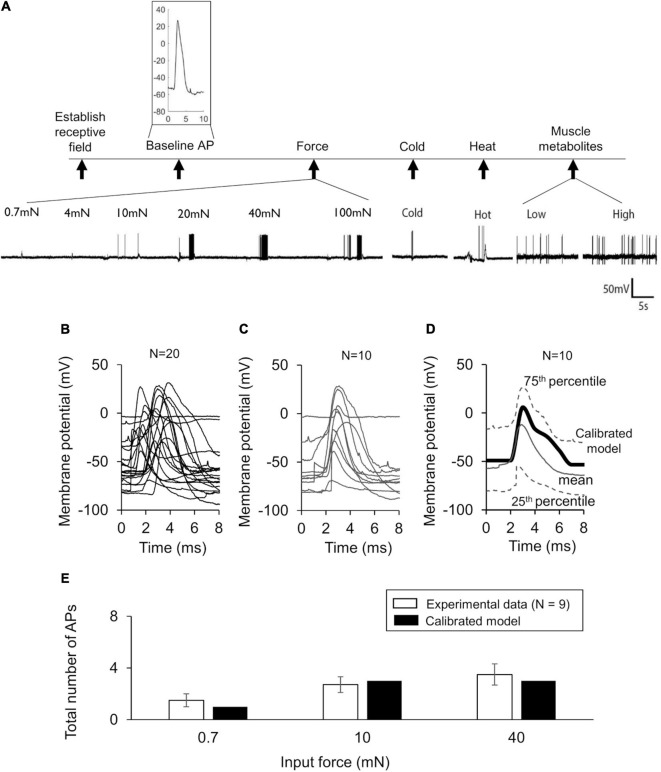
FIGURE 2.
Model calibration using experimental data. (A) Shown are representative membrane potential recordings from a single afferent neuron in wild-type C57BL/6J mouse hindpaw in response to an electrical stimulation [used to generate the baseline action potential (AP)], six mechanical forces, hot and cold temperatures, and muscle metabolites (black vertical arrows). Inset shows a 10-ms trace of the baseline AP extracted from the recording. (B) Shown are the 10-ms traces extracted from the electrophysiological recordings of 20 independent afferent neuron membrane potential recordings. We divided these traces into two sets of 10 neurons each. (C,D) Shown are the baseline AP dataset used for model calibration and the model calibration results, respectively. The solid gray line and the upper and lower dashed gray lines represent the mean baseline AP and the 25th and 75th percentile of the calibration data, respectively. The thick black line represents the model simulation of the AP following an external current stimulus of 80 pA. (E) Shown are the results of the model calibration to the AP response after application of mechanical forces. Open bars represent the mean and one SE of the number of APs generated by seven mechanically sensitive neurons in response to three different mechanical forces. The number of neurons that responded to a specific mechanical force differed across the three applied forces: N = 2 for 0.7 mN, N = 6 for 10 mN, and N = 9 for 40 mN. Solid bars represent the corresponding APs in the simulation.

