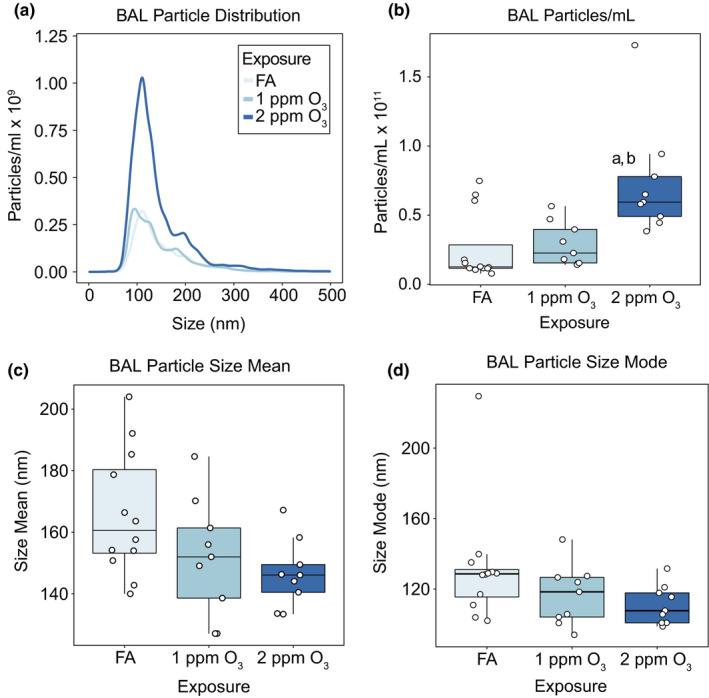
FIGURE 1.

O3 exposure causes increases in EV‐sized particles in the lung. Female C57BL/6J mice were exposed to filtered air (FA; n = 12), 1 (n = 9), or 2 (n = 9) ppm O3 for 3 hours and bronchoalveolar lavage fluid was collected 21 hours later for isolation and analysis of extracellular vesicles. (A) Size distribution, (B) total concentration, (C) size mean, and (D) size mode of particles in BALF samples were measured by nanoparticle tracking analysis. Results are depicted in (A) as the mean particle‐size distribution. In (B‐D) Box‐and‐Whisker plots depict the minimum, first quartile, median, third quartile, and maximum of the data with all points overlaid. a: p < 0.05 compared to the FA group, b: p < 0.05 compared to the 1 ppm group. In (C) and (D), linear regression models demonstrated significant relationship between O3 concentration and size, mean and mode, p‐value =0.016 and 0.049, respectively
