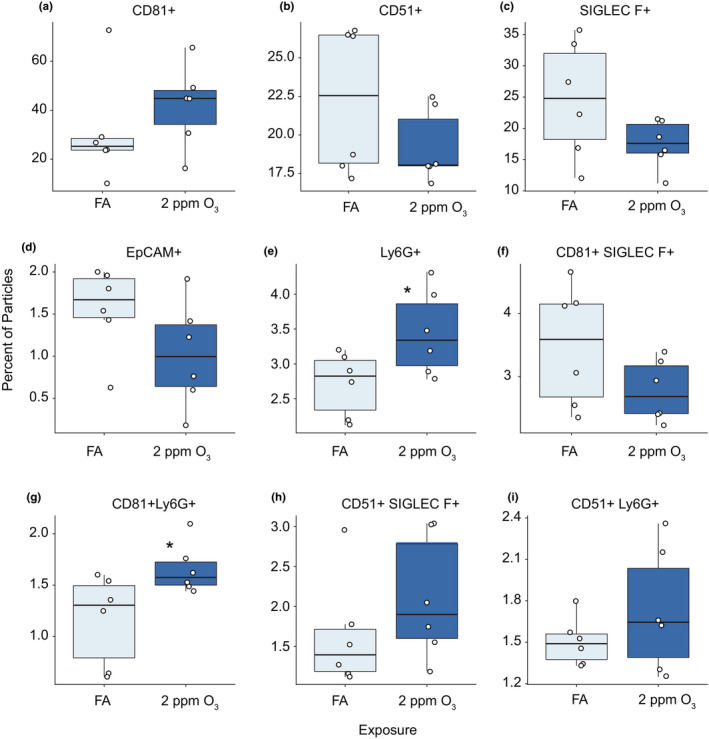
FIGURE 2.

Imaging flow cytometry analysis of BALF EVs. Percentage of EVs positive for (A) CD81, (B) CD51, (C) Siglec‐F, (D) EpCAM, (E) Ly6G, (F) CD81 and Siglec‐F, (G) CD81 and Ly6G, (H) CD51 and Siglec‐F, and (I) CD51 and Ly6G. EVs were isolated for ImageStream analysis from mice 21 hours following a 3‐hour exposure to FA or 2 ppm O3. n = 6 per group. Need to add some indication of stat test results here
