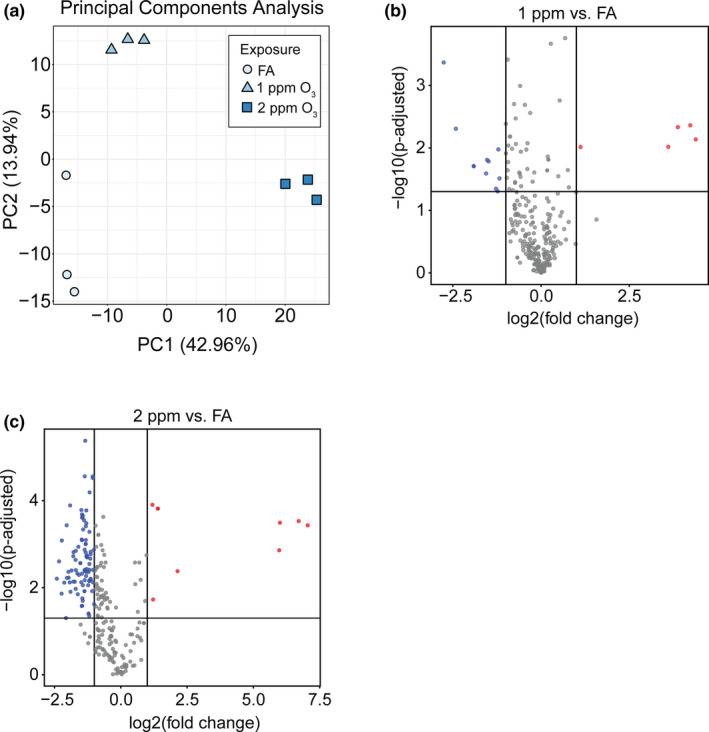
FIGURE 3.

O3 exposure alters airway extracellular vesicle miRNA expression. (A) Principal components analysis showing separation of pooled airway EV samples by exposure group. (B and C) Volcano plots showing differentially expressed (DE) miRNAs in 1 ppm O3 versus FA (16 DE miRNAs) and 2 ppm O3 versus FA (99 DE miRNAs), respectively (horizontal line: p ‐adjusted = 0.05, vertical lines: absolute fold change of ±2). N = 3 EV RNA samples per exposure group, where each sample is a pool of 3–4 individual mice
