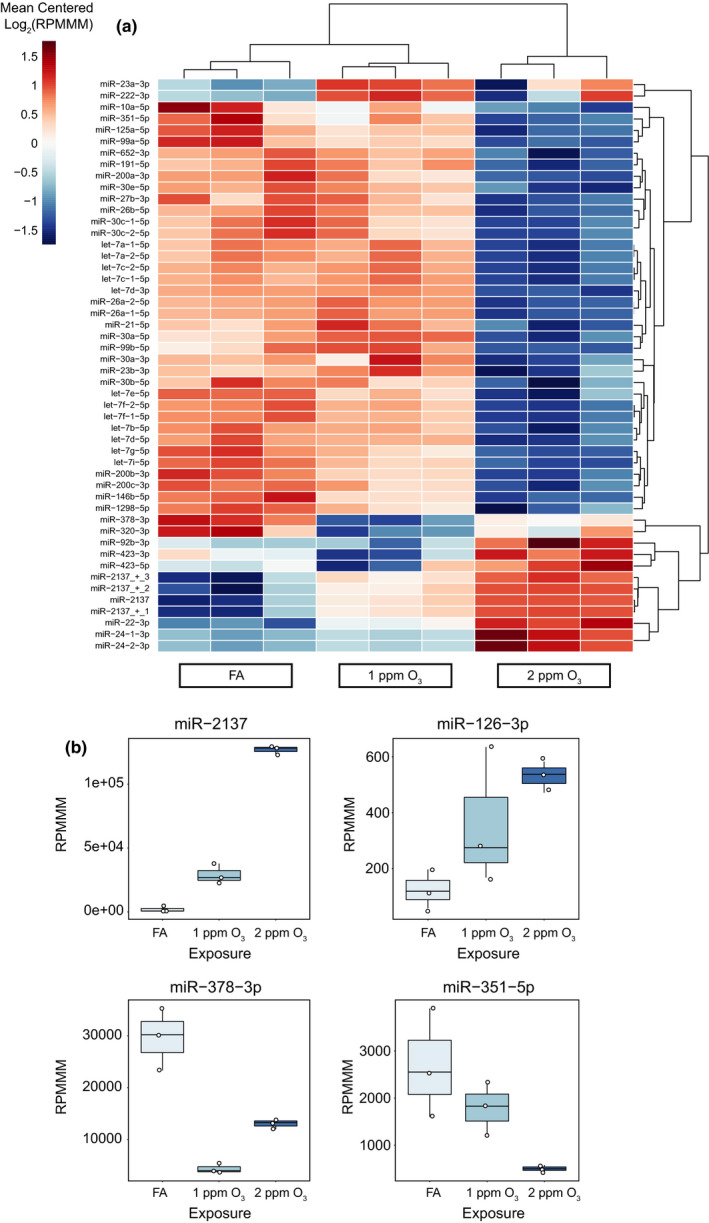
FIGURE 4.

Specific O3‐induced alterations of the EV miRNA landscape. (A) Unsupervised hierarchical clustering analysis of the top 50 most variable EV miRNAs. Data are presented as mean‐centered, log2‐transformed reads per million miRNAs mapped (RPMMM) for each miRNA. (B) Expression of selected O3‐responsive EV miRNAs. Box‐and‐Whisker plots depict RPMMM summarized by the minimum, first quartile, median, third quartile, and maximum with all points overlaid. n = 3 pooled samples per group
