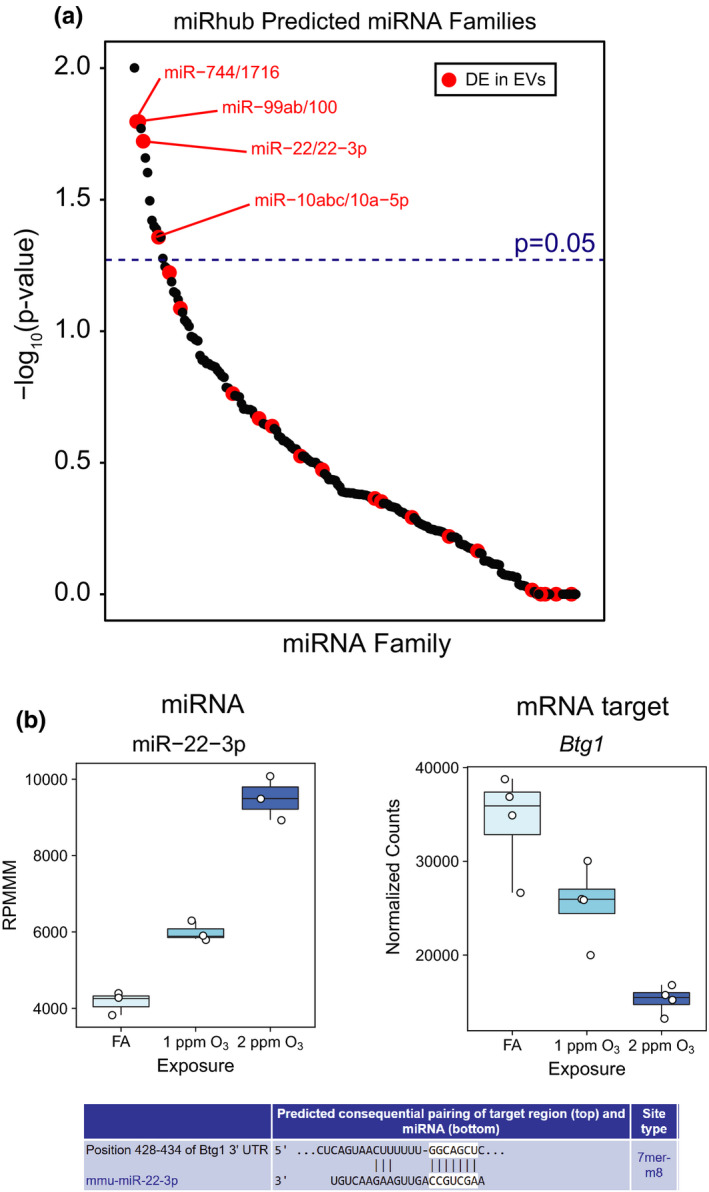
FIGURE 5.

Identification of candidate EV miRNA regulators of O3‐induced transcriptional responses. (A) Results of miRNA target site enrichment analysis, conducted using miRhub, on genes downregulated by 2 ppm O3 versus FA in airway macrophages. Data points are plotted as –log10(p‐value) versus miRNA family and are highlighted if a member of the miRNA family was found to be differentially expressed in airway EVs. (B) Plot depicting RPMMM for EV miR‐22‐3p alongside expression of a predicted airway macrophage mRNA target, Btg1 (normalized counts from DESeq2), and the miR‐22‐3p target site in Btg1 from TargetScan mouse release 7.2. n = 3 or 4 (mRNA data) pooled samples per group
