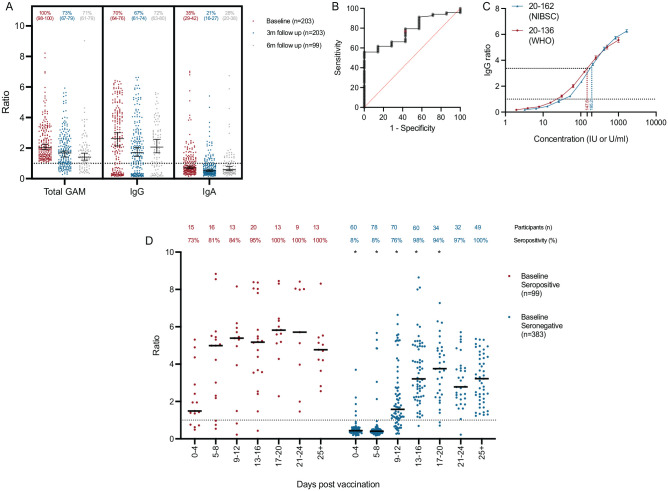
Figure 2.
Longitudinal seroprevalence and vaccine responses in dental care professionals. (A) Total anti–severe acute respiratory syndrome coronavirus 2 (SARS-CoV-2) spike glycoprotein antibodies (Total GAM) and IgG and IgA anti–SARS-CoV-2 spike glycoprotein antibodies measured at baseline and 3-mo and 6-mo follow up. At 6 mo, only individuals who had not been vaccinated are shown. Data are provided as a ratio of the level of antibody compared to the cutoff calibrator set at 1.0. Percentages of individuals above the assay cutoff at each time point are also provided above each column with 95% confidence intervals provided below in parentheses. Median and 95% confidence intervals are also shown. (B) Receiver operator characteristic curve describing the relationship between baseline anti–SARS-CoV-2 spike glycoprotein IgG ratio and binary IgG seropositivity/seronegativity in unvaccinated, non-reinfected individuals at 6-mo follow up. Area under the curve = 0.77, P = 0.01 (n = 75). (C) International reference materials NIBSC 20-136 (World Health Organization) and 20-162 were run in triplicate serial dilutions and the IgG ratio determined. The minimum IgG ratio associated with guaranteed ongoing seropositivity 6 mo from baseline is shown by the red and blue dotted lines. (D) Kinetics of total antibody response in 490 individuals following a single dose of the Pfizer-BioNTech vaccine. *Demonstrates a significant difference (P < 0.05) between the distributions of IgGAM ratios at each time point following vaccination between individuals who were seropositive and seronegative at baseline as determined by Kolmogorov–Smirnov test. Percentage of individuals above the assay cutoff at each time point is also provided.

