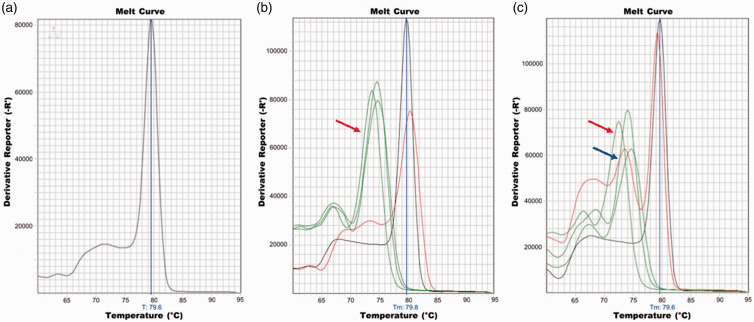
Figure 1.
Melting curve analysis of SARS-CoV-2 S-gene (position 1629–1749) amplicon from (a) control SARS-CoV-2 RNA. Plots (b) and (c) show melting curves of various samples from two Spike qPCR assays. In both plots, the control (SARS-CoV-2 S-gene) is shown in black. Putative SARS-CoV-2 contaminated samples are plotted in red. Fomite sample collected from door threshold outside of patient’s room following HCP encounter is shown in plot (b) while fomite collected from a door handle to a physician’s workroom is in plot (c). The green colored peaks (indicated by the red arrows) on plots (b) and (c) are melting curve for non-specific amplicons from other fomite samples. The melting curve of the sample collected from the door handle to the physician’s workroom (plot (c), indicated by the blue arrow) has multiple peaks, suggesting the presence of multiple amplicons.

