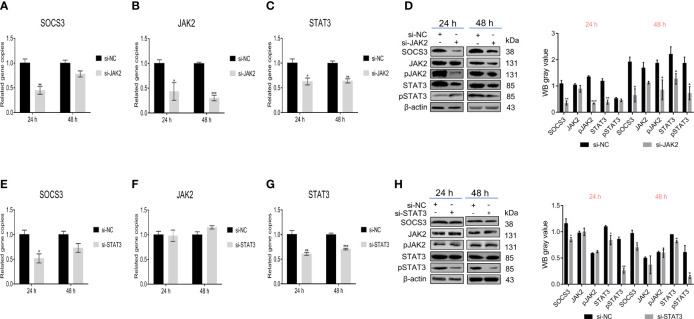
Figure 5.
JAK2/STAT3 inhibited SOCS3 expression. After the knockdown of JAK2 in DF-1 cells, the SOCS3, JAK2, and STAT3 genes expression and the phosphorylation levels of JAK and STAT3 were detected by qRT-PCR (A–C) and WB (D). After knockdown of STAT3 in DF-1 cells, the SOCS3 and JAK2 genes expression and the phosphorylation levels of JAK and STAT3 were detected by qRT-PCR (E–G) and WB (H). These experiments were performed independently at least three times with similar results. Differences in data were evaluated by the Student’s t-test. The error bars are the standard error of the mean (SEMs) (*P ≤ 0.05, **P ≤ 0.01, and ***P ≤ 0.001).

