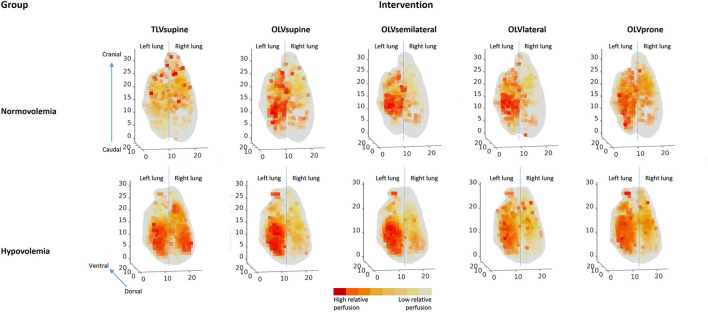
Figure 2.
Representative three-dimensional perfusion maps for one animal from each group. Lungs are shown from the dorsal with the left lung on the left side and right lung on the right side. Axes are divided in cm. Lighter colors represent lower relative pulmonary perfusions, while darker colors represent higher relative pulmonary perfusions.

