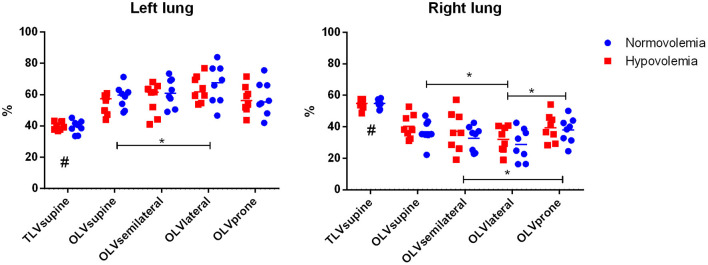
Figure 3.
Relative perfusion of the left and right lungs. Mean and single values. Significance was accepted at P < 0.05. Differences between the two groups, respective body positions, and the sequences of interventions were compared using a linear mixed-effects model with repeated measures, with TLVsupine, OLVsupine, OLVsemilateral, OLVlateral, and OLVprone as within-subject factors and with group and sequence as fixed between subject-factors. The significance of the within-subject factors was corrected for sphericity according to Greenhouse–Geisser. Pairwise post-hoc multiple comparisons were performed according to LSD when appropriate. #P < 0.05 TLVsupine vs. all the others, *P < 0.05. The relative perfusions of the ventilated and the non-ventilated lungs were not different between normo- and hypovolemia (P = 0.457 and P = 0.418, respectively). Mixed effects position × group ventilated lung: P = 0.852 and mixed effects position × group non-ventilated lung: P = 0.891.

