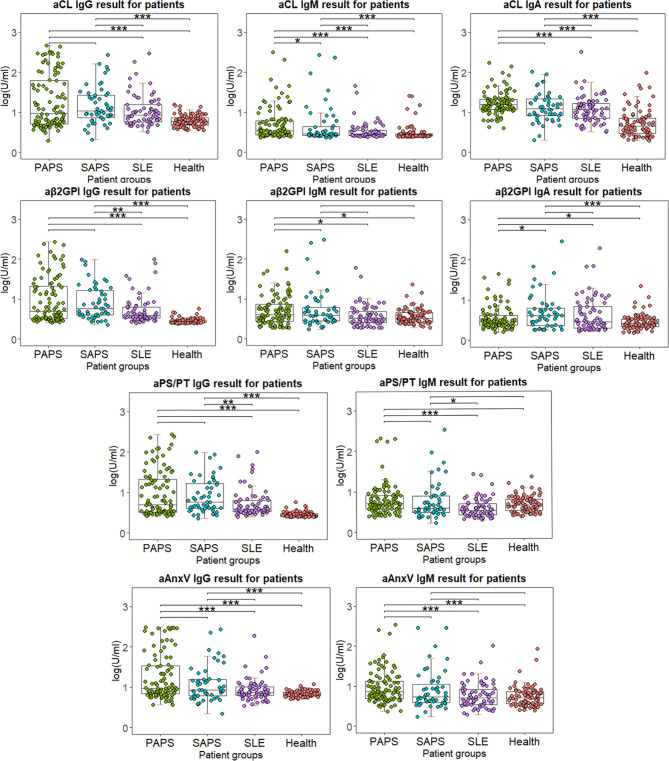
Figure 3.
Distribution of IgG and IgM for four antibodies among different patient groups. Test results are calculated using lg(test value + 2), in order for the value to be shown in positive number. Wilcox’s test is conducted comparing primary or secondary APS results to other patient groups. *p < 0.05, **p < 0.01, ***p < 0.001.

