
FIGURE 2.
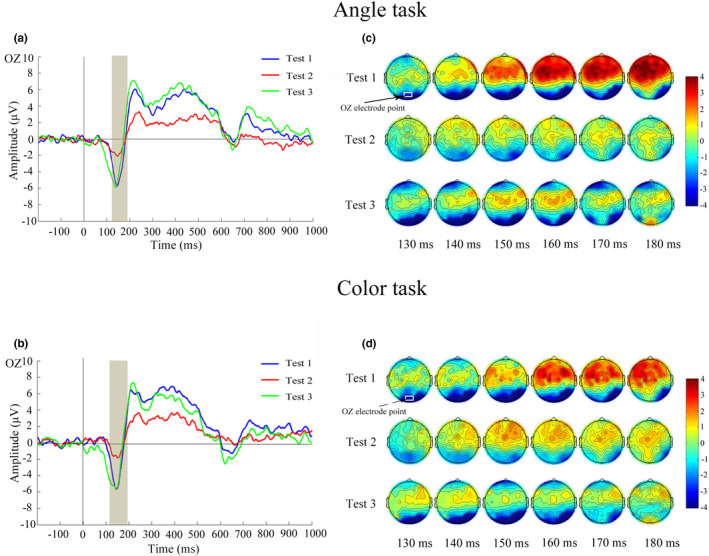
Waveforms of N1 (130–180 ms) and corresponding scalp topographies (generated every 10 ms from 130 to 180 ms) in the three tests. (a) Averaged ERPs at OZ electrode in the three tests elicited by Angle task. (b) Averaged ERPs at OZ electrode in the three tests elicited by Color task. (c) Scalp topographies within the N1 time window in the three tests under the Angle task. (d) Scalp topographies within the N1 time window in the three tests under the Color task. ERP, event‐related potential